 Soku AI
Quality Score is the only place where Google itemizes the price of irrelevance. A keyword at QS 10 earns up to a 50% CPC discount, while a keyword at QS 1–3 can pay up to a 400% premium against the QS 5 baseline — for the same click, in the same auction. And the median account has plenty of room: across a WordStream analysis of 15,666 accounts, the average Quality Score sits at 5–6.
Yet most "Quality Score audits" stop at adding the QS column in the UI and frowning at the low numbers. That misses the two things that actually matter: which low-QS keywords are expensive (a QS 3 keyword with no spend is trivia; a QS 3 keyword eating $2,000/month is a fire), and why each one is low (the fix for a weak headline is completely different from the fix for a slow landing page).
This guide covers the audit method Soku's AI agent uses to do both — the exact metrics, thresholds, and per-keyword root-cause rules. It is part of our step-by-step series on auditing a Google Ads account with an AI agent; this installment goes deep on the Quality Score module.
What Quality Score is (and is not)
Quality Score is a 1–10 diagnostic Google assigns per Search keyword, summarizing three components, each rated Above average, Average, or Below average:
- Expected CTR — how likely your ad is to be clicked when shown for this keyword, judged against peers.
- Ad relevance — how closely the ad's message matches the keyword's intent.
- Landing page experience — how relevant, fast, and usable the post-click page is.
Practitioner research estimates the components are not equally weighted — expected CTR and landing page experience each carry roughly 39%, ad relevance about 22%. Three boundaries worth knowing before auditing:
- QS exists for Search keywords only. Performance Max, Display, and video have quality mechanics, but no visible score to audit.
- The visible 1–10 score is a diagnostic summary, not the live auction input — Google computes auction-time quality per query. But the components are real levers: improve them and both the visible score and your effective CPC follow.
- New or low-impression keywords have no QS at all (null). This matters more than most audits admit, as you will see below.
The two numbers that summarize an account's QS health
A list of keywords sorted by QS is not an audit. Soku's agent reduces the whole account to two spend-aware signals, pulled via one GAQL query on the keyword view with the quality_info fields (score plus all three components) over a 30-day window, ordered by cost.
Signal 1 — Spend-weighted average QS. Multiply each keyword's QS by its cost, sum, divide by total cost:
weighted_QS = SUM(cost × quality_score) / SUM(cost)This weighting is the difference between trivia and money. An unweighted average treats a $5 keyword and a $5,000 keyword identically; the spend-weighted version tells you what the dollars are experiencing. The scorecard:
| Spend-weighted average QS | Verdict |
|---|---|
| ≥ 7.0 | PASS |
| 5.0 – 6.9 | WARN |
| < 5.0 | FAIL |
Signal 2 — Low-QS spend share. The share of total spend flowing through keywords at QS ≤ 4 — the severe underperformers that pay the steepest CPC premiums:
| Spend at QS ≤ 4 / total spend | Verdict |
|---|---|
| < 10% | PASS |
| 10 – 25% | WARN |
| > 25% | FAIL |
Note the two different cutoffs, and that they are intentional. QS below 6 is the diagnosis threshold — any below-average keyword worth investigating. QS 4 and below is the spend-share threshold — the severe tier that disproportionately inflates CPC. A keyword at QS 5 shows up in the diagnosis table but does not count against low-QS spend share. Collapsing the two into one cutoff either drowns you in borderline keywords or hides real problems, which is exactly what happens in most hand-rolled audits.
The data-quality guard most audits skip. Keywords with null QS are excluded from the weighted average — but they are counted, and if null-QS keywords carry more than 30% of spend, the agent refuses to score the module at all and reports insufficient data instead. A weighted average computed over a minority of spend is not representative, and pretending otherwise produces confident nonsense. Common causes of heavy null share: a recent keyword restructure, lots of new keywords, or spend concentrated in low-impression long-tails. Keywords with zero impressions are likewise excluded from all QS math.
Per-keyword root cause: the part that makes the audit actionable
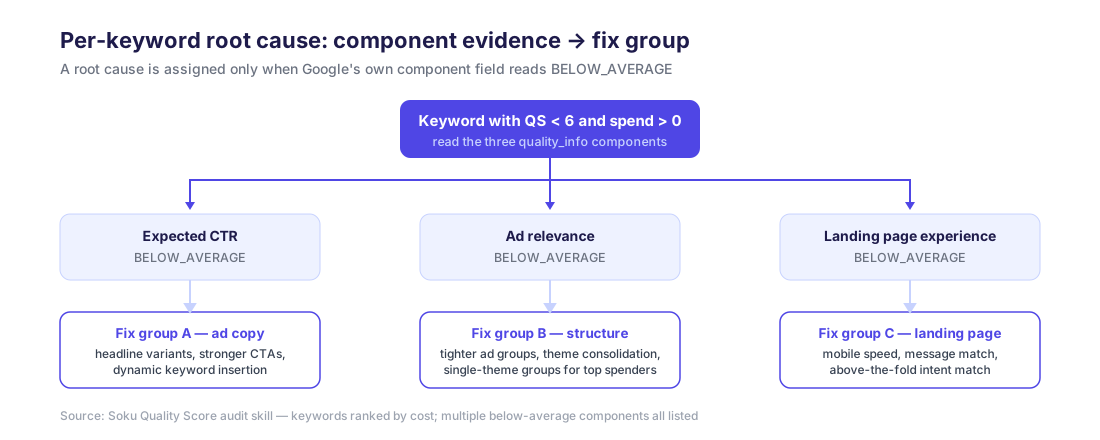
Knowing you have low-QS keywords is worth little. Knowing why each one is low is the audit. For every keyword with QS below 6 and non-zero spend, the agent reads the three component fields and assigns root causes only where a component explicitly reads BELOW_AVERAGE:
| Component below average | Diagnosis | Fix direction |
|---|---|---|
| Expected CTR | The ad does not earn the click | Headlines, call-to-action strength, offer framing |
| Ad relevance | Keyword and ad are mismatched | Ad group structure — tighter themes, fewer keywords per group |
| Landing page experience | The post-click page underdelivers | Speed, message match, above-the-fold intent match |
A keyword can have multiple below-average components — all get listed, and keywords are prioritized by cost descending, so the fix list starts where the money is.
This is a discipline rule as much as a data rule: no root cause without component evidence. A human auditor looking at a QS 3 keyword will guess ("probably the landing page"). The agent is prohibited from inferring a cause from the score alone — if Google's component fields do not say BELOW_AVERAGE, no diagnosis is assigned. Guessed root causes send teams off rewriting pages that were never the problem.
The agent then cross-references Google's own recommendations feed for the same keywords and ad groups — where Google is already suggesting "improve ad relevance" or flagging landing page issues on a keyword the component data flagged, that corroboration gets appended to the finding.
The fix playbook, grouped by root cause
The output of the audit is three fix groups, each with the affected spend attached — so you can see, for example, that "most low-QS spend in this account is an ad relevance problem concentrated in two campaigns."
Group A — Expected CTR fixes. The ad is shown but not chosen. Write headline variants against distinct angles (feature, benefit, urgency, social proof) rather than four rephrasings of one idea; strengthen the call to action; test dynamic keyword insertion where headlines are generic relative to the query. CTR fixes overlap heavily with creative work — the creative audit covers headline coverage and Ad Strength structure in depth.
Group B — Ad relevance fixes. The classic cause is bloated ad groups: twenty keywords with three intents sharing one RSA. The fix is structural — split ad groups until each has one tight theme, consolidate near-duplicate keywords, and for the highest-spend offenders consider single-keyword or single-theme ad groups so the ad can mirror the query. This is usually the cheapest QS win in the account because it requires no new pages and no new copy, just reorganization.
Group C — Landing page fixes. Slowest to fix, and often the largest component. Priorities in order: load speed on mobile, message match (the headline the user clicked should be visible on the page), and intent match above the fold. If the same landing page serves many low-QS keywords with below-average landing page experience, that page is a portfolio-level problem worth fixing before any keyword-level tinkering.
One more connection worth making: low ad relevance is frequently a query problem, not an ad problem — the keyword is matching search terms it should not. If Group B keywords also show messy search terms, run the search terms audit before restructuring; negating the mismatched queries sometimes fixes the component on its own.
How the AI agent runs this vs. doing it by hand
Manually, this audit is: add the QS and component columns in the UI, export, build a cost-weighted pivot, filter QS < 6, read three component columns across hundreds of rows, then open the recommendations tab and cross-reference by hand. Call it a half day, done twice a year, usually sampled rather than complete.
Soku's agent runs it as a skill: one keyword-view GAQL pull with quality_info fields over 30 days, one recommendations pull in parallel, then the math and classification above, for every keyword with spend — in minutes. The output is the scorecard (both signals with verdicts), the per-keyword diagnosis table sorted by cost, the three fix groups with estimated spend affected, and the data-quality notes (null-QS count, excluded zero-impression keywords). The skill is read-only: it never edits keywords, bids, ads, or pages — it produces the evidence and the fix list, and humans decide what to change. Connect an account via the Google Ads integration and ask for a Quality Score audit, or wire your own agent to the API with the Google Ads MCP guide.
For the rest of the audit surface — tracking, search terms, creative, budgets, device splits — see the full step-by-step Google Ads audit guide.
FAQ
Does improving Quality Score directly lower my CPC?
The visible score is a diagnostic, but the components it summarizes feed auction-time quality, which directly sets the CPC needed to hold a position. Practitioner measurements consistently show large effective-CPC differences across QS levels — the 400% premium to 50% discount range cited above.
How fast does QS move after a fix?
Component ratings can update within days of a meaningful change (new RSAs, restructured ad groups); landing page experience tends to move slowest. Re-run the audit after two weeks of data — trend in spend-weighted QS matters more than any single keyword's score.
What should I do about null-QS keywords?
Nothing directly — QS arrives with impressions. Their audit relevance is coverage: if they carry a large share of spend, your QS numbers describe too little of the account to act on, which is why the agent enforces the 30% guard.
Is a QS of 5–6 actually bad?
It is average, in the literal sense — the cross-account average is 5–6. Whether it is your problem depends on the spend-weighted picture: a 5.8 average with 4% of spend at QS ≤ 4 is a very different account from a 5.8 average with 30% of spend in the severe tier.
Does this apply to Performance Max?
No — PMax exposes no keyword Quality Score. The audit levers for PMax are asset completeness and negative keywords, covered in the creative audit and the pillar guide.