 Soku AI
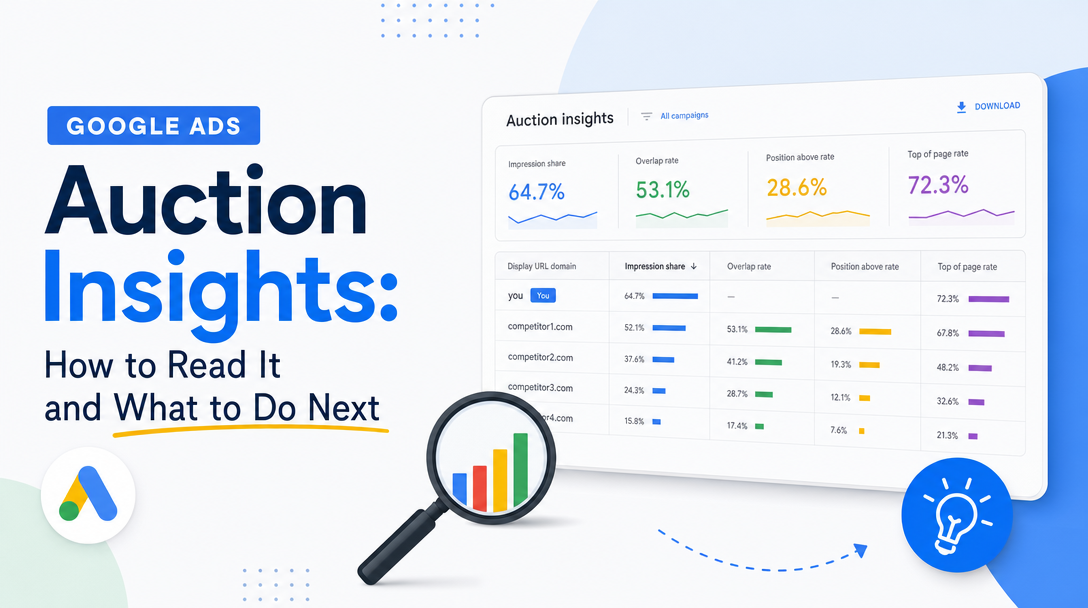
Auction Insights is the only place Google shows you, by name, who else is in your auctions. It is also the report most likely to be read wrongly, because its six metrics look like they are all measured the same way and they are not — they have three different denominators, and one of them counts something almost nobody expects.
This post covers what each metric actually measures, the four competitive patterns the metrics combine into, the blind spot that hides the report from the advertisers who most need it, and — the part most guides skip — the specific action each pattern calls for.
What the Report Contains
Auction Insights compares your performance against other advertisers who participated in the same auctions as you. It is available at campaign, ad group and keyword level, and the metric set depends on campaign type:
| Metric | Search | Shopping | What it measures |
|---|---|---|---|
| Impression share | ✓ | ✓ | Impressions received ÷ impressions eligible to receive |
| Overlap rate | ✓ | ✓ | How often another advertiser got an impression when you also did |
| Outranking share | ✓ | ✓ | How often you ranked higher or showed when they did not |
| Position above rate | ✓ | — | How often their ad showed in a higher position than yours |
| Top of page rate | ✓ | — | How often your ad showed above the unpaid results |
| Absolute top of page rate | ✓ | — | How often your ad was the very first ad above organic |
Performance Max is segmented by its Search and Shopping channels, with the corresponding metrics for each — meaningful competitive visibility into a campaign type that used to be close to a black box.
The Three Denominators
Here is the thing that makes the report easy to misread. These metrics are not all fractions of the same base.
Impression share is a fraction of auctions you were eligible for. Its denominator is an estimate Google produces from your targeting, budget and eligibility — it is not a count of anything observable, and it moves when your eligibility changes even if your performance does not.
Overlap rate is a fraction of your impressions. It answers: when my ad showed, how often did theirs also show? Because the denominator is your own volume, a small competitor who only ever bids on your highest-volume terms can post a very high overlap rate. Overlap rate measures co-occurrence, not size. A 70% overlap rate does not mean the competitor is 70% as big as you; it means that when you showed, they usually did too.
Position above rate is a fraction of shared auctions — the ones where you both appeared. This is the cleanest head-to-head signal in the report, and it is the one to trust when you want to know who is actually winning.
And then there is outranking share
Read Google's definition slowly, because the second half is where people go wrong. Outranking share is how often your ad ranked higher in the auction than another advertiser's ad, or if your ad showed when theirs did not.
That trailing clause means outranking share counts every auction where you appeared and they were absent entirely.
So a high outranking share can mean either of two completely different things:
- You genuinely beat them when you meet, or
- You simply cover far more of the market than they do, and most of your "wins" are walkovers in auctions they never entered.
Those call for opposite responses. The first means you are competitive and should hold. The second means you have breadth but have not tested whether you win where it counts — and a competitor concentrating budget on your best terms can be quietly beating you head-to-head while your outranking share against them looks healthy.
The fix is simple: never read outranking share alone. Pair it with position above rate, which is scoped to shared auctions only. High outranking share plus high position above rate means your lead is coverage, not strength.
The Four Patterns
Individual metrics are close to useless. Combinations are diagnostic. Almost every competitor you see falls into one of four patterns.
Pattern 1 — The direct rival
High overlap rate, high position above rate, similar impression share.
You are in the same auctions and they are frequently beating you in them. This is a genuine head-to-head fight, and it is the only pattern where a bid or Quality Score response is clearly warranted.
What to do: Check whether the gap is bid or quality before spending anything. If your Quality Score on the affected keywords is 6 or below, ad rank is being taxed by relevance and landing-page experience, and raising bids buys the same position at a worse price permanently. Fix quality first; bid second. If quality is already strong, the gap is budget or bid, and it is an economics decision — work out what the incremental position is worth at your conversion rate before matching them.
Pattern 2 — The phantom
Low overlap rate, but they appear prominently in the report.
You share few auctions. They are bidding on adjacent terms, in different geographies, or at different times of day. This looks like competition and mostly is not.
What to do: Usually nothing — and resisting the urge to react is the whole skill here. The genuinely useful move is the opposite of defensive: segment by keyword to find which terms you overlap on. A low overall overlap rate with a concentrated pocket of shared terms tells you where they think the money is, which is competitive intelligence worth more than any bid change.
Pattern 3 — The encroacher
Overlap rate rising month over month, your impression share flat or falling.
Someone is expanding into your terms. This is the pattern worth catching early, because it is the only one that is cheap to address before it matures.
What to do: Identify the specific keywords driving the overlap increase, then check whether your impression share loss is to rank or to budget — the two impression-share-lost columns answer this directly and they call for different responses. Lost to budget means you are leaving auctions you already win on merit; that is a forecasting and pacing fix. Lost to rank means you are being outcompeted where you show up.
Pattern 4 — The one you are beating
High position above rate in your favour, high overlap.
You are winning shared auctions consistently.
What to do: Check what it costs. Sustained dominance in a contested auction is often bought at a cost per acquisition that stopped making sense two quarters ago, and nothing in Auction Insights will tell you that — the report has no concept of your margin. This is the pattern where the correct action is most often to reduce something: pull back from absolute-top bidding, let the average position drift, and watch whether conversions actually fall. Frequently they do not.
The Under-10% Blind Spot
Auction Insights requires a minimum threshold of activity for the selected period, and will not display when your impression share is less than 10%.
Sit with the implication. The advertisers who most need to understand their competitive position — new accounts, small budgets, tightly capped campaigns, anyone entering a crowded category — are precisely the ones the report refuses to show. Competitive visibility is gated on already having presence.
Practical workarounds, in order of usefulness:
- Widen the date range. The threshold is evaluated over the selected period, so a quarter often renders when a week does not.
- Move up a level. A single ad group may be under the threshold while the campaign clears it.
- Segment after it renders, not before. Get the report to display at the broadest level, then narrow.
And one thing not to do: do not read absence as absence. A competitor missing from your report may be below the activity or privacy threshold rather than out of the auction. The report shows the advertisers you overlap with most, not a complete competitive set. Treating it as a full census is how agencies end up confidently briefing clients that a known rival "isn't bidding anymore."
What the Report Will Never Tell You
It does not show competitor bids, budgets, Quality Scores, keywords or targeting. It reports relative outcomes, nothing about inputs.
This matters because impression share is a function of bid, Quality Score, budget, targeting and eligibility simultaneously, and those cannot be separated from the outside. When a competitor's impression share rises 15 points, every one of these is a valid explanation:
- They raised budgets
- They improved Quality Score and now win the same auctions cheaper
- They expanded targeting into geographies or hours you already covered
- You narrowed your own eligibility, changing the denominator underneath them
- Seasonality changed the auction mix
The last two are the ones people forget, and they are common. A competitor's numbers can move entirely because of something you did. Before you build a story about a rival's strategy, check whether your own budget, targeting or scheduling changed in the same window. More competitive panics are caused by an unnoticed budget cap than by an actual offensive.
If you want to know what a competitor is actually doing, Auction Insights is the wrong instrument — it tells you that something changed, not what. Their live ad copy, landing pages and offers are observable directly, and that is where the answer usually is.
How to Actually Use It in a Monthly Review
The mistake is checking Auction Insights on a schedule and hunting for something to react to. Every number in it is comparative, so everything moves constantly, and a weekly cadence mostly manufactures false alarms.
Invert the order:
- Start from your own metrics. Did cost per acquisition, conversion volume or impression share move materially?
- Only then open Auction Insights, to test whether a competitor explains it.
- Segment to keyword level on the campaigns that moved. Account-level auction data is too blunt to act on — the pattern is almost always concentrated in a handful of terms.
- Classify each meaningful competitor into one of the four patterns above.
- Act only on Patterns 1 and 3, and on Pattern 4 when the economics have drifted. Pattern 2 is noise, and treating it as signal is the most expensive mistake in this report.
Auction Insights fits alongside the rest of a structured account review rather than replacing it — see the Google Ads audit checklist for where it sits relative to search terms, quality and budget pacing, and AI Max vs Performance Max for how competitive visibility differs across the newer campaign types.
The Honest Summary
Auction Insights is a good report with a badly named metric and a threshold that hides it from the people who need it most. Read outranking share as coverage rather than strength, trust position above rate for head-to-head questions, treat overlap rate as co-occurrence rather than size, and remember that the denominator of impression share is an estimate that moves when you do.
Most of all: the report tells you that the competitive picture changed. It never tells you whether reacting is worth the money. That judgement needs your margin, your conversion rate and your creative performance sitting in the same view as the auction data — which is exactly what Soku is built to do, reading auction dynamics alongside spend and conversions so the question becomes should we respond rather than did something move.
Related Reading
- Google Ads Audit Checklist — the full account review Auction Insights belongs inside.
- Google Ads Quality Score Audit — how to tell whether a Pattern 1 gap is bid or quality before you spend on it.
- AI Max vs Performance Max — competitive visibility across Google's newer campaign types.