 Soku AI
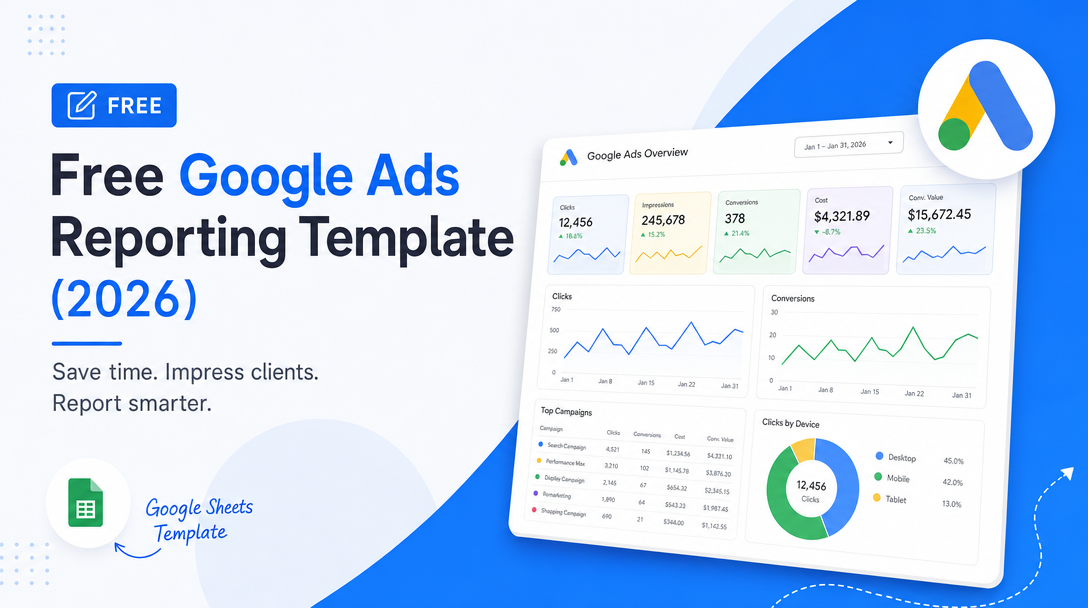
Every "free Google Ads report template" on page one of Google costs something. We checked all eight of them on 2026-08-13: six require an account with the vendor before the template does anything, four require connecting a live Google Ads account through their paid connector, and two are 14-day trials wearing the word "free."
That is not a complaint about lead magnets. It is a description of a real gap. The thing most people actually want — a plain structure they can copy into a spreadsheet, fill in from the Google Ads UI, and send to a client on Friday — is not on page one at all, because nobody can monetise it.
So this page is that. A copy-paste reporting structure, the metric definitions that make each tab honest, and the specific reporting mistakes that make a competent account look incompetent.
The template
Three tabs, because Search, Shopping and Performance Max fail in different ways and a single blended tab hides all three.
Tab 1 — Search
| Column | Source in Google Ads | Why it is here |
|---|---|---|
| Campaign | Campaigns view | The reporting unit |
| Impressions | Campaigns view | Denominator for everything else |
| Clicks | Campaigns view | — |
| CTR | Clicks ÷ Impressions | Ad and query relevance |
| Avg. CPC | Cost ÷ Clicks | Auction pressure |
| Cost | Campaigns view | — |
| Conversions | Campaigns view | Must state which conversion actions are included |
| Cost / conv. | Cost ÷ Conversions | The number the client actually cares about |
| Conv. rate | Conversions ÷ Clicks | Separates traffic problems from landing-page problems |
| Search impr. share | Competitive metrics | How much of the demand you are missing |
| Search lost IS (budget) | Competitive metrics | Missing because you are too poor |
| Search lost IS (rank) | Competitive metrics | Missing because you are not good enough |
The last three columns are the ones people leave out, and they are the ones that turn a report into a decision. "Cost per conversion rose 18%" is a fact. "Cost per conversion rose 18% and lost impression share to rank rose from 12% to 34%" is a diagnosis — you are being outbid, not mismanaged.
Tab 2 — Shopping
Shopping keeps the Search columns and adds four:
| Column | Why it is here |
|---|---|
| Product title / item ID | Shopping performance is a product distribution, not a campaign average |
| Revenue | Shopping is almost always revenue-reported, not lead-reported |
| ROAS | Revenue ÷ Cost |
| Benchmark CPC | Google's own comparison to competing sellers on the same product |
The single most useful Shopping view is not in campaign order. Sort by cost descending, then look for rows with spend and zero revenue. In most accounts a small number of products consume a disproportionate share of budget while converting nothing, and they are invisible in any campaign-level roll-up.
Tab 3 — Performance Max
Performance Max deserves its own tab because most of the Search columns are either unavailable or misleading for it.
| Column | Note |
|---|---|
| Campaign | — |
| Cost | — |
| Conversions | — |
| Conv. value | — |
| ROAS | — |
| Asset group | The closest thing PMax has to an ad group |
| Search themes / listing groups | What you actually control |
| Channel split (where reported) | The perennial "is this just Shopping wearing a hat" question |
Do not put impression share in this tab. Do not put CTR in this tab and then compare it to Search. PMax spans channels with structurally different CTRs, so a blended PMax CTR compared against a Search CTR is a meaningless number that will be read as meaningful.
Tab 4 — The summary the client reads first
One block, five lines, written in the client's language rather than the platform's:
- Spend this period vs last
- Result this period vs last (leads, or revenue — pick one and never switch)
- Efficiency (cost per lead, or ROAS)
- What changed and why — one sentence, causal
- What we are doing next — one sentence, specific
If the report cannot fill in the last two lines, the report is a data dump and the client will eventually notice.
The metric definitions that make it honest
A reporting template is only as good as the definitions underneath it, and three of them are routinely wrong in client reports.
Conversions is not a number, it is a selection. The Conversions column contains only the conversion actions marked Primary. Change which actions are primary mid-quarter and the trend line breaks with no visible cause. Any report that spans a definition change and does not say so is misleading, however accurate the arithmetic.
Conversions are attributed to the click date, not the conversion date. A conversion that happens today against a click from eleven days ago is reported against that earlier day. This means recent days are always understated and always fill in later. A Monday report showing "last week collapsed" is very often just the conversion lag. State the lookback window on the report.
Cost is not spend. Google's Cost column is the auction cost. What lands on the invoice can differ because of over-delivery credits, invalid-click adjustments and currency conversion. For anything that gets reconciled against finance, take the number from Billing, not from the Campaigns view.
The reporting mistakes that make good accounts look bad
Blending brand and non-brand. Brand search converts at several times the rate of everything else and costs a fraction as much. Any account-level cost-per-conversion that includes brand is dominated by how much brand traffic happened to arrive, which is mostly a function of demand you did not create. Split brand into its own campaign and its own reporting row, always. This single change explains more surprising month-over-month swings than any other.
Comparing a 31-day month to a 28-day month. February is not a catastrophe. Use like-for-like day counts or daily averages when comparing periods of different lengths, and align on day-of-week where the account has a weekday pattern.
Reporting position. Average position was removed in 2019 and is not coming back. If a template still has that column, it was written before the change and everything else in it is suspect too.
Reporting on a period shorter than the sales cycle. A weekly report on a product with a six-week consideration window measures noise. Report weekly on leading indicators (spend pacing, impression share, CTR, cost per click) and monthly or quarterly on outcomes.
Averaging ROAS across campaigns. ROAS is a ratio, and the mean of ratios is not the ratio of totals. Compute total revenue ÷ total cost, never the average of the per-campaign ROAS column.
Building it in Looker Studio instead
If you want the template live rather than pasted, the free path is Looker Studio with the native Google Ads connector — it is genuinely free and needs no third-party vendor.
- Create a new report and add the Google Ads data source (Google's own connector, not a partner one).
- Select the account, not the manager account, unless you actually want cross-account roll-up.
- Build one page per tab above. Use a scorecard row for the summary block and a table for the detail.
- Add a date-range control and a campaign filter control; without them, every question becomes a new report request.
- Set the comparison to previous period by default, so every number arrives with a direction.
The one thing Looker Studio will not do for you is the "what changed and why" line. That is the part that is actually worth paying a human — or an agent — for.
Where the reporting stops and the deciding starts
Here is the uncomfortable thing about reporting templates. A report is a description of what already happened, produced on a cadence chosen for the convenience of the person receiving it. By the time a monthly report shows that lost impression share to rank climbed, the month in which it climbed is over.
The reason reporting templates are perennially in demand is not that people love reports. It is that the reporting layer is where most teams first notice anything. That is a diagnosis of the alerting layer, not the reporting layer.
The useful move is to demote the report. Let the weekly and monthly documents do what they are good at — communicating to someone who was not in the account — and move the actual detection to something that runs continuously: budget pacing checks, impression-share thresholds, cost-per-conversion drift, zero-revenue product spend. Soku runs that continuous layer as an ads agent, so the monthly report becomes a summary of decisions already taken rather than the moment the decisions get made.
If you want the recurring operating cadence that sits behind that, the companion piece is our Google Ads optimization checklist, which covers what to actually do weekly, monthly and quarterly. For the client-facing multi-channel version of this template, see the free PPC report template for Meta.
Frequently asked questions
Is there a genuinely free Google Ads reporting template?
Yes — Looker Studio with Google's native Google Ads connector is free with no seat cost, no row cap and no trial. The templates that require payment are the third-party ones, which mostly exist to sell a connector to data sources Looker Studio does not natively support.
How often should I send a Google Ads report?
Match the cadence to the sales cycle. Weekly for leading indicators on high-volume accounts, monthly for outcomes on most accounts, quarterly for anything with a consideration window longer than a month. Weekly outcome reporting on a low-volume account reports mostly noise.
Which metrics should be in a client-facing Google Ads report?
Spend, the outcome the client buys (leads or revenue), efficiency (cost per lead or ROAS), and the direction of each versus the prior period. Everything else belongs in an appendix. Impression share and lost impression share to budget and rank belong in the appendix but should be read by whoever writes the commentary.
Why do my Google Ads conversions keep changing after the fact?
Conversions are credited to the date of the click, not the date of the conversion, so recent days backfill as delayed conversions arrive. This is expected behaviour, not a tracking fault. Report with a stated lookback window, and avoid drawing conclusions from the most recent few days.
Should Performance Max be in the same report as Search?
In the same report, yes; in the same table, no. PMax spans channels with different structural CTRs and offers different controls, so blending it into a Search table produces comparisons that look meaningful and are not.