 Soku AI
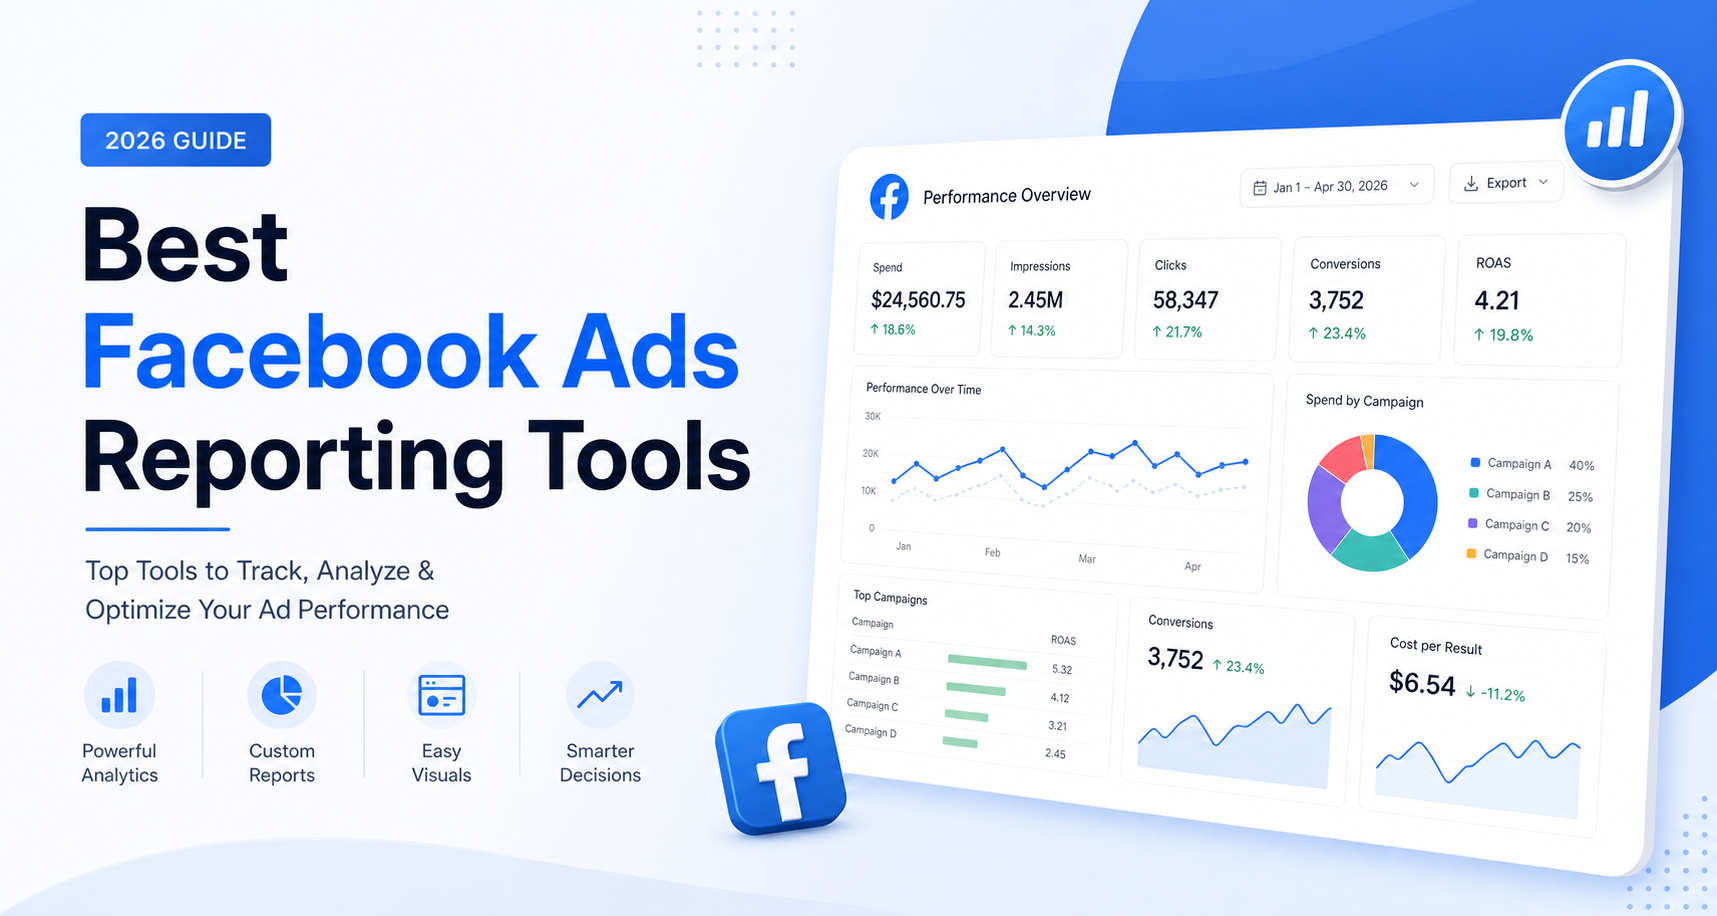
Search "Facebook Ads reporting tool" and you get a list of twenty products that are not competitors. Some are data pipes. Some are report builders. One is free and comes from Meta. They get ranked against each other on integration counts, which is roughly like ranking a delivery van against a shop window.
So this guide is organised around the only question that actually determines what you should buy: what are you trying to do with the numbers?
All prices below were verified against each vendor's own pricing page on 2026-07-31.
The Three Categories
Category 1 — Connectors (data pipes)
What they do: move Meta Ads data out of Meta and into somewhere you can work with it — Looker Studio, Google Sheets, Excel, Power BI, a warehouse.
What they do not do: design anything. You still build the report.
Who they are: Supermetrics, Porter Metrics, Funnel, Windsor.ai, Coupler.
How they charge: on the shape of your data plumbing — number of data sources, accounts per source, users, and destinations.
Category 2 — Report builders (client reporting platforms)
What they do: connect to the platforms and produce the finished, branded, scheduled report. The dashboard is the product.
What they do not do: give you much freedom below the level of their templates.
Who they are: AgencyAnalytics, Whatagraph, DashThis, Databox.
How they charge: per client, or per bundle of source credits — that is, on the shape of your client roster, not your data.
Category 3 — Native and free
What they do: Meta Ads Manager's own custom reports; Google's Looker Studio as a free canvas.
Who they are for: anyone whose real requirement is "I need to see my numbers", which is a larger share of buyers than the market wants to admit.
The catch: Looker Studio has no native Meta connector. That single gap is the reason Category 1 exists as a business.
The buying rule: your cost driver should match your growth driver. If you grow by adding clients, a per-client tool scales with your revenue. If you grow by adding data complexity for a fixed set of brands, a per-source tool does. Mismatch these and your bill grows on an axis your revenue does not.
Category 3 First: What You Get For Nothing
Start here, because skipping it is how people end up paying $199/month to rebuild something they already had.
Meta Ads Manager reporting lets you build custom column sets, apply breakdowns (by placement, age, gender, region, time), save report views, export, and schedule reports by email. It is a real reporting tool. It is free. It requires no pipeline, no refresh schedule, and no maintenance when an API version deprecates.
Its three genuine limits:
- It only knows about Meta. If the question is "how did Meta do against Google", it cannot answer.
- It only knows Meta's attribution. You cannot apply your own model.
- It cannot be white-labelled. No agency logo, no client portal.
Looker Studio is Google's free dashboard canvas — unlimited reports, free sharing, and native connectors to Google properties. What it does not have is a native Facebook or Instagram Ads connector. So the free option is free right up until Meta enters the picture, at which point you are shopping in Category 1.
Analysis: if all three of Meta's limits are irrelevant to you, stop reading and use Ads Manager. A meaningful share of the "best Facebook Ads reporting tool" audience is a solo advertiser or in-house marketer who needs limit 1 solved eventually and limits 2 and 3 never.
Category 1: Connectors
Supermetrics — the category standard
The default answer, and priced like it. Verified on supermetrics.com/pricing, 2026-07-31:
| Plan | Monthly | Billed yearly | Data sources | Accounts/source | Users | Destinations |
|---|---|---|---|---|---|---|
| Starter | $49/mo | $39/mo | 3 | 3 | 1 | 1 core |
| Growth | $199/mo | $159/mo | 7 | 7 | 2 | 1 core |
| Pro | $499/mo | $399/mo | 10 | 10 | 3 | 1 core |
| Enterprise | Custom | Custom | All | Custom | Custom | Core and data warehouse |
Destinations available across plans include Looker Studio, Google Sheets, Microsoft Excel and Power BI — and, notably in 2026, ChatGPT, Claude and Microsoft Copilot. Supermetrics states there are no data volume fees.
The trap, and it is the most expensive thing on this page: every self-serve tier includes one core destination, and data warehouse destinations are Enterprise-only.
Read the pricing table again with that in mind. The jump from Pro to Enterprise is not primarily about volume — 10 data sources is plenty for most agencies. It is the tier where warehousing becomes possible at all. So a team that prices Supermetrics against "we need Meta in Looker Studio" at $199/month, and then starts a BigQuery project two quarters later, is not adding a line item. They are entering a custom-quote negotiation.
Price it against your destination roadmap, not your current dashboard.
Note also that four users is not a supported shape below Enterprise: Pro tops out at 3. For a five-person analytics team, the seat count binds before the source count does.
Pick it if: you want the broadest connector coverage and a single destination you are confident about.
Skip it if: a warehouse is on your roadmap and you want a published price for it, or your team is larger than three seats.
The cheaper connectors
Porter Metrics, Windsor.ai and Coupler compete directly with Supermetrics on price for the common case — Meta and Google Ads into Looker Studio. We were unable to resolve Porter Metrics' pricing page in our capture on 2026-07-31, so we are not quoting figures for it rather than repeating numbers from comparison blogs.
Analysis: the honest position on this sub-category is that for the narrow job of "Meta Ads into Looker Studio", the connectors are close to commoditised. Supermetrics' premium buys breadth of sources and organisational maturity, not a better Facebook connector. If you have exactly two sources and one destination and no plans to change, price the cheaper options seriously — and check refresh frequency and historical backfill limits, which is where the cheap tiers usually differ and where the difference actually bites.
Category 2: Report Builders
AgencyAnalytics — the per-client model
Verified on agencyanalytics.com/pricing, 2026-07-31.
One plan, Core, at $20 USD per client per month — monthly, or billed annually with 20% savings. Included: automated client reporting, white-label branding, a client portal, goals, alerts and anomaly detection, API access, AI insights and analysis, 85+ integrations, benchmarks and forecasting, and unlimited staff and client users.
Add-ons are separate: an AI Tracker at $20.83/month per 250 credits and a Rank Tracker at $41.67/month per 500 keywords, both on annual billing. Database connectors are an add-on. Enterprise is custom for agencies with 25+ clients.
Why the pricing model matters more than the feature list: at $20 per client with unlimited seats, cost tracks your client count exactly. Five clients is $100/month. Twenty is $400/month. That is the correct shape for an agency, because the bill grows only when revenue does — and it is the wrong shape for an in-house team, which has one "client" and would be paying $20/month for a platform designed around a problem it does not have.
Pick it if: you are an agency, you report to clients repeatedly, and unlimited seats matter.
Skip it if: you are in-house with one brand, or your reporting needs are bespoke enough that templates fight you. If the per-client model is the part that does not fit, the AgencyAnalytics alternatives comparison works through the tools priced per seat, per source and per workspace instead.
Whatagraph — the enterprise end
Verified on whatagraph.com/pricing, 2026-07-31.
Max starts from €699 per month, billed annually, with 50+ source credits and unlimited seats. Prime is custom-priced and annual, with 100+ source credits, premium integrations, custom report domains, BigQuery and Looker access, and priority support. Both include a 14-day free Max trial with no credit card required.
The unit here is source credits, not clients — a third billing model in a market that already had two. That makes direct comparison with AgencyAnalytics genuinely hard, which is presumably not accidental.
Analysis: €699/month is roughly 35 AgencyAnalytics clients. If you have fewer than 35 clients and are choosing Whatagraph, you are buying something other than price — depth of integrations, custom domains, or the warehouse access in Prime. Those are legitimate reasons. "It is the better reporting tool" generally is not, at that multiple.
Pick it if: you are an established agency where custom domains and premium integrations matter, and seats are genuinely unlimited across a large team.
Skip it if: you are under about 20 clients. The arithmetic does not work.
Side by Side
| Tool | Category | Entry price (verified 2026-07-31) | Unit of billing | Seats at entry |
|---|---|---|---|---|
| Meta Ads Manager | Native | Free | — | — |
| Looker Studio | Native canvas | Free (no Meta connector) | — | Unlimited |
| Supermetrics | Connector | $49/mo ($39 annual) | Sources × accounts × users × destinations | 1 |
| AgencyAnalytics | Report builder | $20/client/mo | Active clients | Unlimited |
| Whatagraph | Report builder | €699/mo billed annually | Source credits | Unlimited |
Note that no two rows share a billing unit. That is the real reason "best Facebook Ads reporting tool" listicles are unhelpful — the products are not priced on a comparable axis, so any ranking is really a ranking of which billing model happens to suit the author's reader.
How To Choose In One Pass
Answer in order, stop at the first yes:
- Do you only need Meta, only for yourself, with Meta's own attribution? → Meta Ads Manager. Free. Stop.
- Do you produce branded reports for multiple clients on a schedule? → A report builder. AgencyAnalytics if under ~25 clients, Whatagraph if you need custom domains and premium integrations at scale.
- Do you need Meta data combined with other sources in your own dashboard? → A connector. Count your destinations first, then your sources.
- Do you need history beyond platform retention, CRM joins, or your own attribution model? → A warehouse, which means Supermetrics Enterprise or a competitor with published warehouse pricing. Decide this before you buy a self-serve tier.
- Is your actual problem that you do not know what to change? → None of the above. See below.
The Thing No Reporting Tool Does
Worth ending on plainly, because it is the most common disappointment in this category.
Every tool here moves numbers and arranges them. None of them decide anything. A dashboard tells you CPA rose 18% last week. It does not tell you that it rose because one ad set absorbed 60% of budget after a creative refresh, and it does not pause that ad set.
That gap is where reporting spend quietly stops paying. The failure mode is not a bad tool — it is a beautiful weekly report that nobody acts on, which costs you the subscription plus the hour spent reading it. Before buying, ask what will happen differently because the report exists. If the honest answer is "we will know", that is worth something, but much less than the price of the enterprise tier.
If the answer you want is "and then something changes", that is a different category of product entirely — one that reads the accounts, works out what moved and why, and proposes the next action rather than rendering the last one. That is what Soku does, across Meta, Google and TikTok together.
Related Reading
- Madgicx alternatives — where Meta reporting overlaps with Meta automation.
- Optmyzr alternatives — the same question on the Google Ads side.