 Soku AI
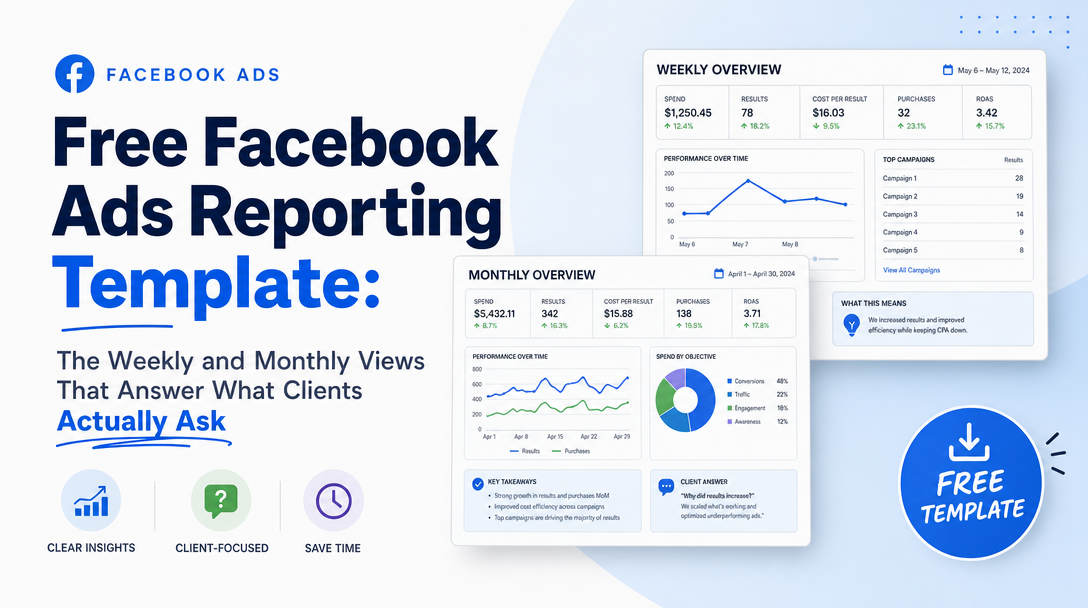
Most Facebook Ads reports are a screenshot of Ads Manager with a paragraph on top. They get skimmed, they do not get acted on, and the person who built it spends two hours a week producing something nobody reads carefully.
The fix is not a nicer chart. It is recognising that you are being asked for two different documents by two different readers, and that trying to serve both with one file is what makes both bad.
This is a free template for both. Copy the tables below into a sheet, or use them as the structure for whatever tool you already have. Every column is defined, every derived metric has its formula, and nothing is included that you cannot act on.
The Four Questions Every Report Must Answer
Before any table, hold these. If your report does not answer all four, the format is not the problem.
- Did we hit the number? Spend against budget, results against target, efficiency against the agreed CPA or ROAS.
- What did we change, and why? A report without a decision log is a weather forecast.
- What did we learn? Tests that concluded, and what they concluded. Not tests that are running.
- What happens next? Named actions, not "continue to monitor".
The single most common failure is opening with impressions and reach. Those describe how the machine ran; the reader is asking whether the business got anything. Put mechanism in the appendix.
View 1 — The Weekly Operating Report
Reader: whoever runs the account. Grain: campaign, and ad set when diagnosing. Job: decisions for the coming week.
1.1 Header block
| Field | Value |
|---|---|
| Account | |
| Week | Mon DD – Sun DD |
| Spend this week / budget | |
| Pacing vs month-to-date target | ahead / on / behind, with % |
| Headline | One sentence. The thing that matters. |
The headline sentence is not decoration. If you cannot write it, you have not read your own report.
1.2 Performance by campaign
Export these columns from Ads Manager and nothing else:
| Column | Source | Why it earns its place |
|---|---|---|
| Campaign name | Ads Manager | |
| Amount spent | Ads Manager | |
| Results (purchases or leads) | Ads Manager | Set the results column to your actual objective, not "all conversions" |
| Cost per result | Ads Manager | |
| Purchase ROAS | Ads Manager | Ecommerce only; leave out for lead gen |
| Δ cost per result vs last week | derived | (this week − last week) / last week |
| Δ spend vs last week | derived | Tells you whether an efficiency change was caused by a volume change |
| Frequency | Ads Manager | Fatigue signal — only meaningful at ad-set level and above |
The two delta columns are the ones that turn a table into a report. An absolute CPA of $34 means nothing on its own; $34 against $27 last week on 40% more spend is a finding with a cause already attached.
1.3 Creative performance
Only include creative with enough data to be worth discussing — a practical floor is 1,000 impressions and at least a handful of results. Below that you are reading noise and, worse, presenting it as a conclusion.
| Column | Notes |
|---|---|
| Ad name | Use a naming convention; if you do not have one, this column is where you will notice |
| Impressions | Context only |
| Hook rate | derived: 3-second video plays ÷ impressions. Did the thumb stop? |
| Hold rate | derived: ThruPlays ÷ 3-second video plays. Did the message survive? |
| Unique CTR (link) | Separates genuine interest from repeat clicks |
| Cost per result | The one that decides |
| Days live | Fatigue is a function of exposure, not the calendar |
Hook rate and hold rate are the two derived metrics that pay for themselves on video accounts. A low hook rate with a good hold rate is a creative-opening problem — change the first second, keep the ad. A good hook rate with a low hold rate means the opening wrote a cheque the rest of the ad did not honour. Reporting only CTR collapses those two very different diagnoses into one number.
1.4 Changes made this week
| Date | Campaign / ad set | Change | Rationale | Expected effect |
|---|
Fill this in as you go, not on Friday. It is the difference between a report that explains performance and one that describes it. It is also the artefact that saves you in a quarterly review.
1.5 Next week
Three to five named actions with an owner. "Continue monitoring" is not an action and should never appear.
View 2 — The Monthly Business Report
Reader: whoever pays the invoice. Grain: account, occasionally channel. Job: show the trend and defend the plan.
Nothing at ad level belongs here. That is not simplification for its own sake — the monthly reader is deciding whether to keep funding the channel, and ad-level detail actively obscures that decision.
2.1 The one table that matters
| Metric | This month | Last month | 3-month trend | Target | Status |
|---|---|---|---|---|---|
| Spend | |||||
| Results | |||||
| Cost per result | |||||
| ROAS (platform-attributed) | |||||
| MER (business-wide) | |||||
| New-customer share of results |
Two rows here do the real work.
MER alongside ROAS. ROAS is Meta's own attribution grading its own homework; MER is total business revenue divided by total marketing spend, taken from your books. They will disagree, and the size of the gap is more informative than either number. A ROAS that improves while MER is flat usually means attribution is claiming credit for demand you were going to capture anyway.
New-customer share. An account can hold its blended ROAS steady for months while quietly shifting spend onto people who would have bought regardless. Without this row, that looks like stability.
2.2 Trend, not snapshot
One chart: cost per result by week over the last 13 weeks, with a line for target. Thirteen weeks is deliberate — it is long enough to show a trend through seasonality and short enough that a change three months ago is still relevant.
Do not send a month-over-month bar chart of two bars. Two points is not a trend and everyone reading it knows.
2.3 What changed structurally
A short prose section, five sentences at most: what you tested, what you concluded, what you are doing differently next month, and any platform-side change that affected delivery. That last one matters more than it used to — attribution windows, consent behaviour and eligibility rules move without notice, and a report that never mentions the platform implies every movement was your doing.
2.4 Risks and asks
The section most agencies leave out and most clients want. Budget constraints, creative supply, tracking gaps, approvals you are waiting on. If a report never contains an ask, it is being written to reassure rather than to operate.
The Metrics To Leave Out
Actively cut these unless they are load-bearing for a specific argument:
- Impressions and reach as headline numbers. Context, not findings.
- CPM in isolation. It moves for auction reasons you did not cause. It matters when explaining a CPA change, not on its own.
- Post engagements, page likes, video views on a performance account. They are not what you were hired for.
- Any metric that has not changed a decision in three months. If you cannot name the decision it would drive, it is padding.
The discipline that makes a report readable is subtraction. Every extra number lowers the odds that the important ones get read.
Setting It Up In Ads Manager
To make this repeatable rather than a weekly rebuild:
- Build a custom column preset with exactly the weekly columns above, and save it. Ads Manager will otherwise reset to a default set that includes several metrics you decided not to report.
- Set the attribution window explicitly and record it in the report header. A report that does not state its attribution window is not comparable to last month's, and the difference between 7-day-click and 7-day-click-plus-1-day-view is large enough to reverse a conclusion.
- Use a breakdown-free export for the main table. Adding a breakdown silently changes the denominators, and totals stop reconciling.
- Name campaigns and ads consistently so the creative table sorts usefully. If you do not have a convention, adopt one before you build the report, because retrofitting it across a live account is much worse.
- Export on the same weekday, at the same time. Conversion data backfills; pulling Monday one week and Wednesday the next introduces a difference that looks like performance.
When A Spreadsheet Stops Being Enough
This template works as a spreadsheet, and for one or two accounts a spreadsheet is the right answer. It stops working at around five accounts, or as soon as two people maintain it.
The reason is not effort — it is that spreadsheet reporting fails silently. A stale date range, a copy-paste that misses a row, a currency column that changed: each produces a report that looks completely normal and is wrong. Nobody catches it, because the artefact is the same shape either way. The argument for a reporting tool is not visual, it is that the numbers arrive by pull rather than by hand.
If you are at that point, we compared the options and their real pricing in Facebook Ads reporting tools, and the white-label question specifically in white-label PPC reporting. If the problem is deciding which creative deserves budget rather than reporting on what already happened, that is a different job — ad creative testing covers it.
Use It
Copy the two views, delete anything you cannot act on, and keep the decision log. That last one is the part most teams skip and the part that makes the report worth writing — six months from now, the only record of why the account looks the way it does will be the rationale column nobody wanted to fill in.