 Soku AI
Attribution models are usually compared on how "fair" they are — last click is crude, linear is naive, data-driven is sophisticated. That framing produces bad decisions, because it implies the sophisticated model is always the better choice.
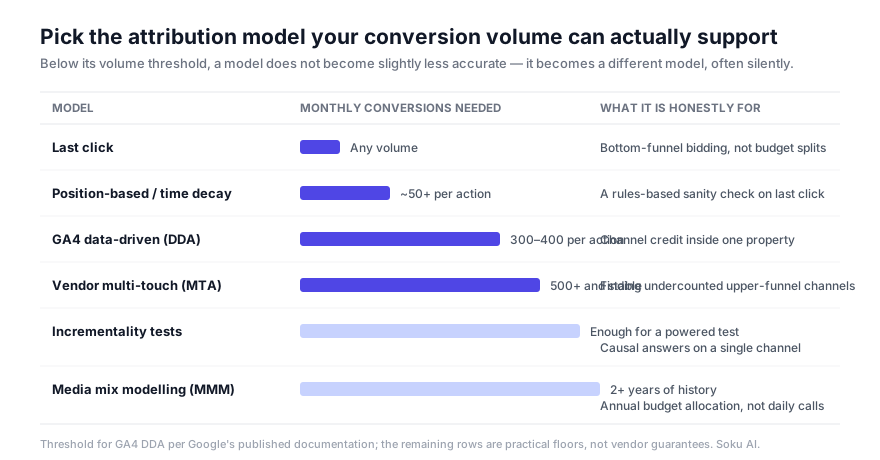
The better question is narrower and more useful: which model does my conversion volume actually support, and what decision am I trying to make with it? Below its volume threshold a model does not get slightly less accurate. It becomes a different model, often without telling you.
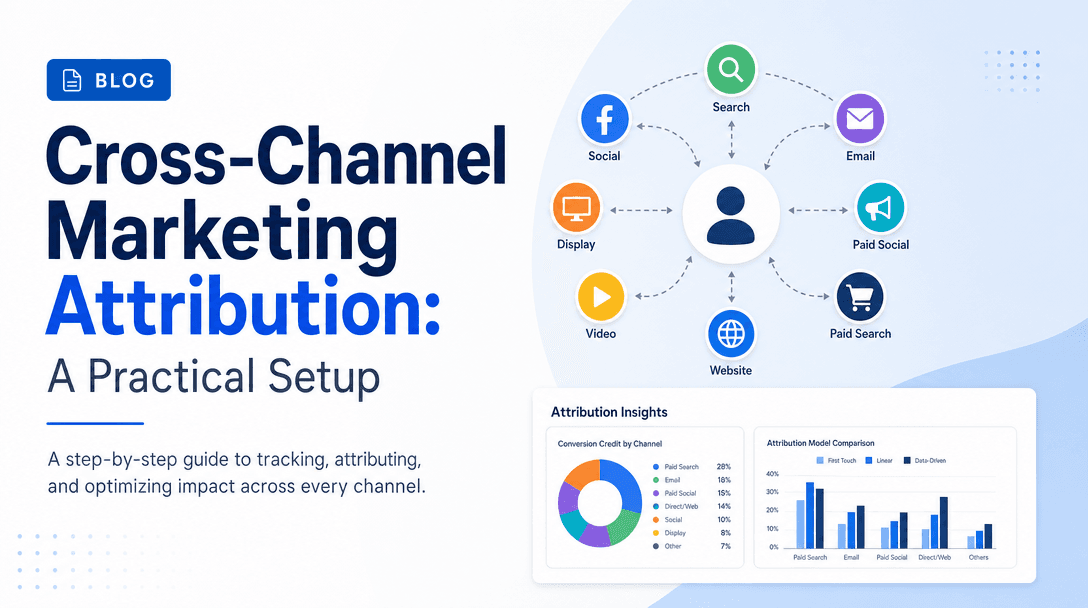
This is the ranked version of that question. For the full setup around it — tagging, server-side collection, the three layers of the stack — see the pillar: Cross-channel marketing attribution: a practical setup.
The criterion: volume, then decision
Every model on this list is a way of dividing credit across touchpoints. Dividing credit requires enough events to see a pattern. When there are not enough events, the model either overfits noise or falls back to something simpler.
So the ranking below is by minimum monthly conversion volume per conversion action — not per account, not in total. A site with 400 conversions spread across six conversion actions has roughly 65 per action, which is a very different situation from 400 on one action.
Second criterion: what decision the model is honestly for. A model that answers "which ad set to pause" is not the same tool as one that answers "should we keep spending on LinkedIn," and using the first for the second is where most attribution arguments actually come from.
1. Last click — any volume
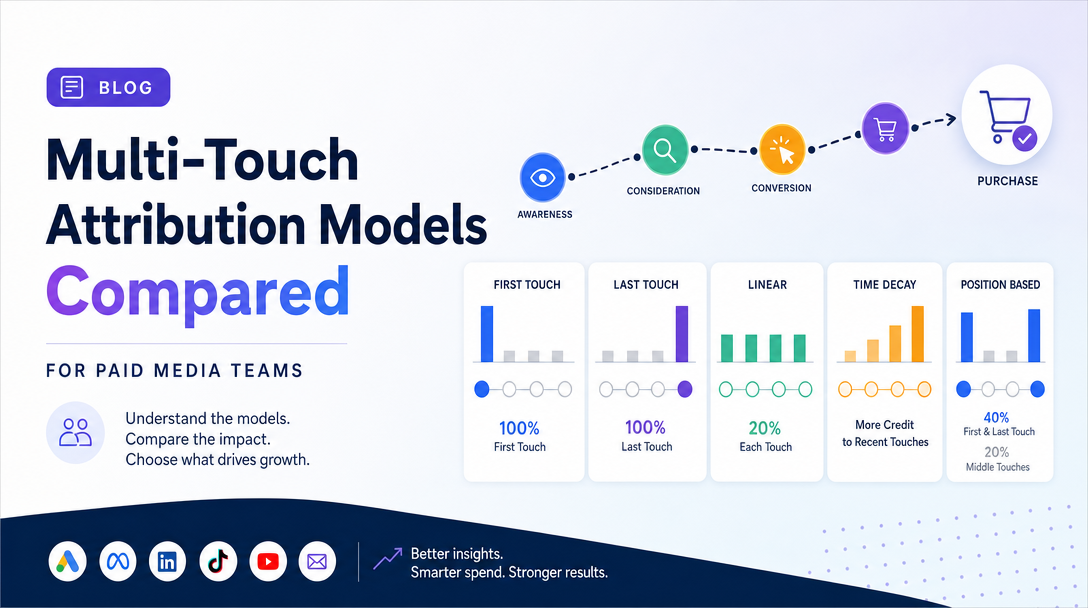
Gives 100% of the credit to the final touchpoint before conversion.
What it is honestly for: bottom-funnel bidding decisions and low-volume accounts. If you have 40 conversions a month, last click is not a compromise — it is the only model that will not hallucinate.
Its real failure: it systematically undervalues awareness channels. The classic version is cutting LinkedIn or paid social because it shows near-zero conversions, when it is introducing prospects who convert through branded search two weeks later. The channel that closes gets credit for the demand another channel created.
When to keep using it: more often than the industry admits. A last-click report everyone understands, used only for in-platform optimisation, beats a data-driven model nobody can validate.
2. Position-based and time decay — roughly 50+ per action
Position-based (U-shaped) gives fixed weight to the first and last touch, splitting the remainder. Time decay weights recent touches more heavily.
What they are honestly for: a rules-based sanity check on last click. Running last click and position-based side by side tells you how much your upper funnel is being undercounted, which is a genuinely useful number even though neither model is causal.
Their real failure: the weights are arbitrary. A 40/20/40 split is not a finding about your business; it is a convention someone chose. Do not defend a budget decision with a number whose distribution was picked by a spreadsheet default.
Note on availability: GA4 removed first-click, linear, time-decay, and position-based as primary model options in November 2023. If you want these, you are running them outside GA4.
3. GA4 data-driven attribution — 300–400 per action
Uses machine learning on your own conversion paths to assign fractional credit, comparing paths that converted against paths that did not.
What it is honestly for: channel credit inside one property. It is a real improvement over rules-based models when it has enough data, and it is free.
Its real failure, and this is the important one: GA4's DDA needs roughly 300–400 monthly conversions per conversion action. Below that threshold it silently reverts to last-click behaviour — and the report interface still says data-driven. There is no warning banner. Teams have spent entire quarters debating what "the data-driven model is telling us" while reading last-click numbers with a different label.
Check this first. Before any GA4 attribution discussion, pull conversions per conversion action for the last 30 days. If any action is under ~300, treat its DDA column as last click.
4. Vendor multi-touch attribution — 500+ and stable
Third-party platforms that build an identity graph across site, ads, and CRM, then model credit across the full journey. 75% of companies now run some form of MTA, up from 58% in 2024, and teams implementing it report 14–36% cost-per-acquisition improvement and around 19% ROI lift in the first year.
What it is honestly for: finding channels that platform-reported data systematically undercounts. As a diagnostic, this is real value — it is the fastest way to discover that a channel showing zero last-click conversions is upstream of a third of your pipeline.
Its real failure: it depends on tracking individuals across sites, apps, and devices, and that capability has been eroding continuously. Third-party cookie deprecation, iOS tracking restrictions, and the closed nature of the major ad platforms have made the underlying identity graph structurally incomplete — and vendors model around the gaps rather than measuring them.
This is why Measured argues MTA is effectively dead while TapClicks argues MTA and MMM have to work together. Both are right about different claims. MTA as a causal verdict is dead. MTA as a diagnostic that tells you where to run an incrementality test is very much alive — and considerably cheaper than testing every channel blind.
Buying advice: if the vendor's pitch is "finally know the true ROI of every channel," discount it. If the pitch is "find the channels your platform data is hiding, then go test them," that is the product working as intended.
5. Incrementality testing — enough volume for a powered test
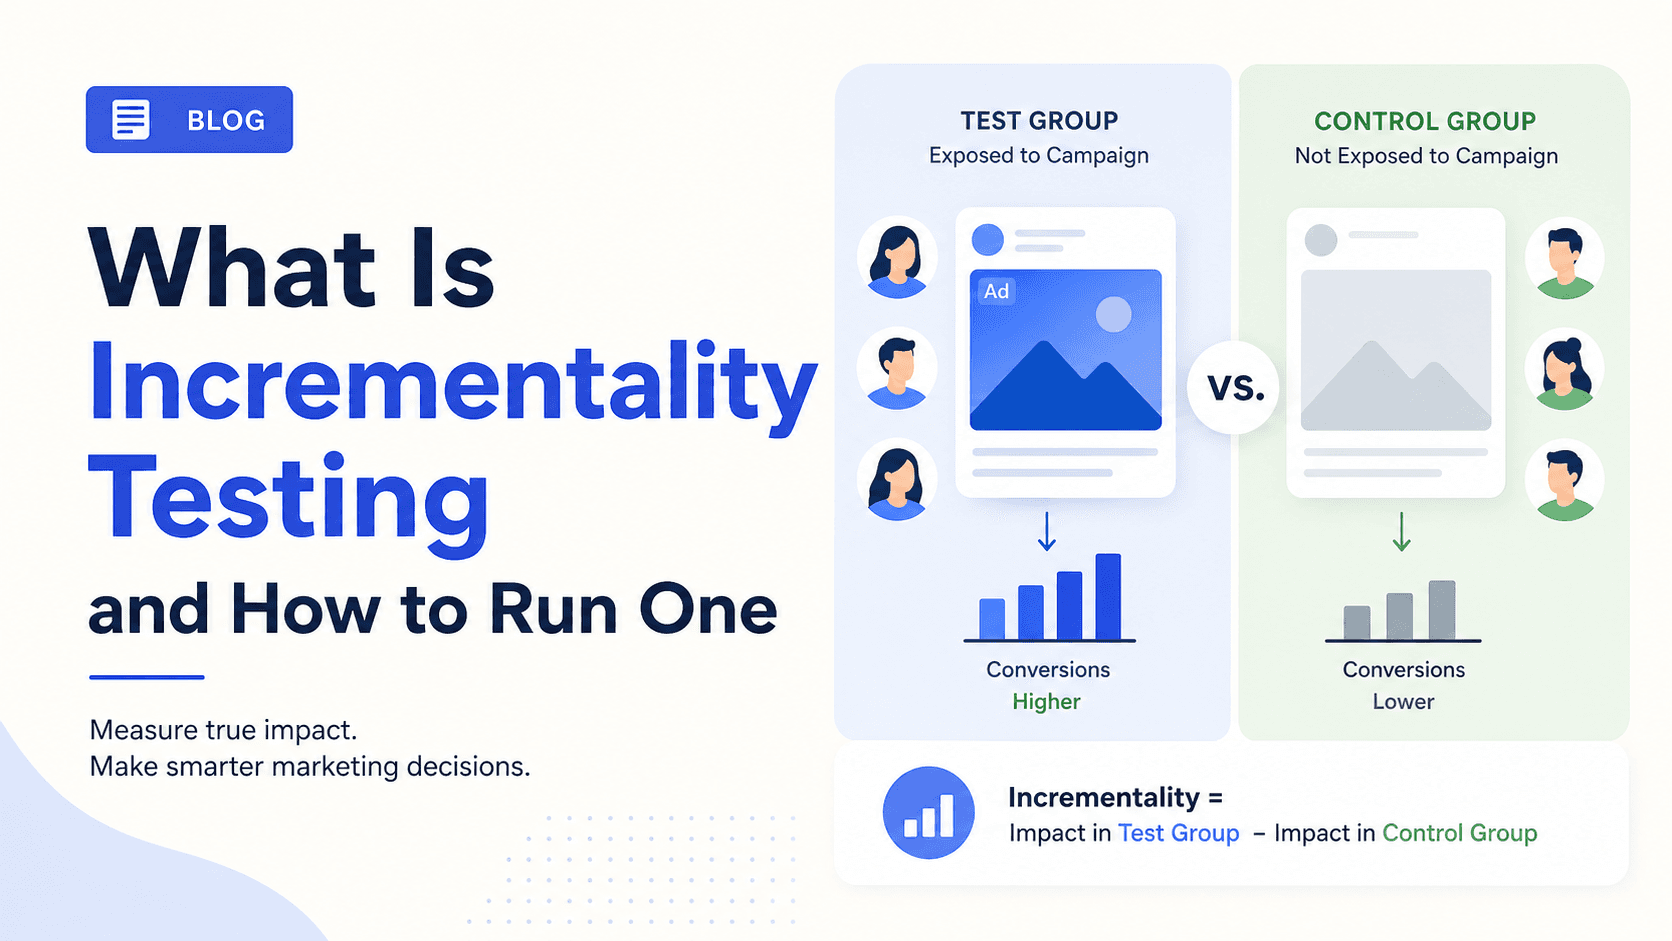
Geo holdouts, conversion lift studies, deliberate spend-off windows. You withhold spend from a comparable group and measure the difference.
What it is honestly for: the only causal answer in this list. It is the only number here you can put in front of a CFO and defend without caveats about identity graphs.
Its real failure: it answers one question at a time, takes weeks, and costs real money in withheld spend. You cannot run it on forty ad sets. You run it on the two or three channels where the budget is large enough that being wrong is expensive.
How it pairs with MTA: MTA is cheap and broad but not causal. Incrementality is expensive and narrow but causal. Use the first to generate the shortlist and the second to settle it. That sequencing is the practical resolution of the "MTA is dead" argument.
6. Media mix modelling — 2+ years of history
Regression on historical spend and outcomes, modelling the shape of returns per channel at an aggregate level. No user-level tracking, so privacy changes do not degrade it.
What it is honestly for: annual and quarterly budget allocation. How much goes to each channel, and where saturation begins.
Its real failure: it is coarse and slow. MMM cannot tell you which creative to pause today or which keyword is bleeding. Teams that adopt MMM as a replacement for tactical measurement end up flying with no instruments at the level where daily decisions are made.
Cost of entry: the history requirement is real. If you have been spending seriously on three channels for eight months, MMM will fit noise. Wait.
The comparison table
| Model | Min. monthly conversions | Causal? | Honestly for | Main risk |
|---|---|---|---|---|
| Last click | Any | No | In-platform bidding | Undervalues upper funnel |
| Position-based / time decay | ~50 per action | No | Sizing the undercount | Arbitrary weights |
| GA4 data-driven | 300–400 per action | No | Channel credit in one property | Silent fallback to last click |
| Vendor MTA | 500+ and stable | No | Finding hidden channels | Incomplete identity graph |
| Incrementality | Enough for a powered test | Yes | Settling budget arguments | Slow, narrow, costs withheld spend |
| MMM | 2+ years history | Partially | Annual allocation | Useless for daily decisions |
How to actually choose
Work down this list and stop at the first honest answer.
- Under ~300 conversions per action per month? Last click, used only for in-platform decisions. Do not buy an MTA vendor. Spend the money on getting server-side conversion tracking and campaign tagging right instead — that is the constraint, not the model.
- Between 300 and 500? GA4 data-driven, after verifying volume per conversion action. Add position-based as a side-by-side comparison to size how much upper funnel is being undercounted.
- Above 500 and stable, spending across four or more channels? MTA becomes worth its cost — as a diagnostic. Budget for incrementality tests on the top two channels it flags, or you have bought a report rather than a decision.
- Spending seriously for two or more years? Add MMM for annual allocation. Keep the tactical layer for everything below the quarterly horizon.
The pattern in all four: pick the most sophisticated model your volume genuinely supports, and not one step further. Every step of over-reach costs you either money or credibility, and usually both.
Where Soku fits
Soku sits on the decision side rather than the measurement side. It connects to Meta, Google, TikTok, and ChatGPT Ads, generates creative variants, launches structured tests, and reports which variant carried the spend.
The relevance to model choice is specific: a structured creative test is a small incrementality test you can afford to run continuously. You are not asking a model to infer which creative deserves credit from observational data — you are running the comparison directly. That does not solve channel-level attribution, but it does remove creative-level decisions from the set of things your attribution model has to be right about, which is a meaningful reduction in how much weight the model has to carry.
Where to go next
- The full setup: Cross-channel marketing attribution: a practical setup — the three layers, the build order, and the failure modes.
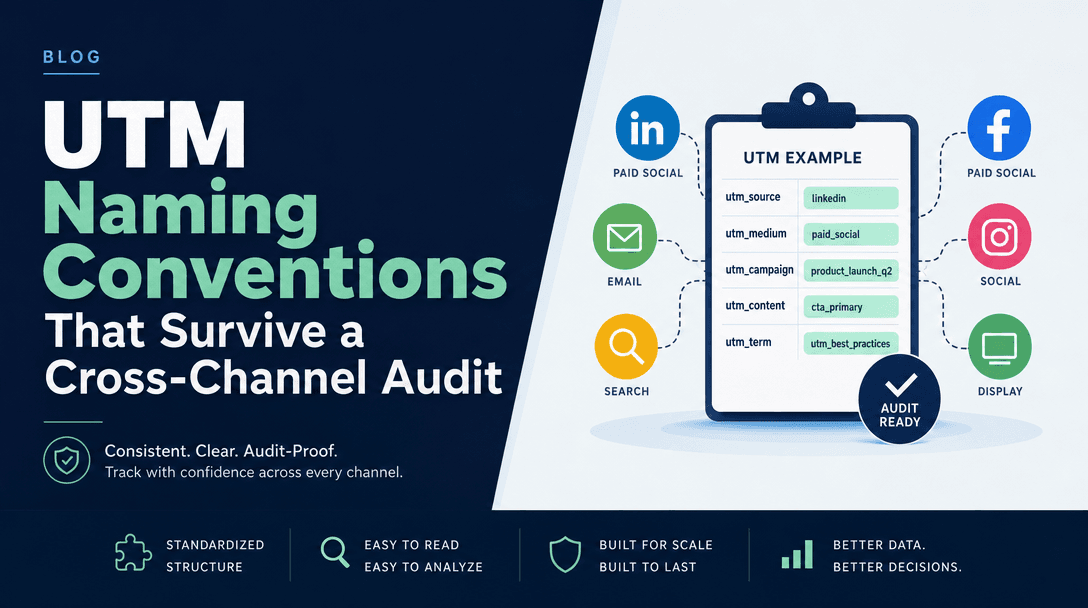
- Fix the join key first: UTM naming conventions that survive a cross-channel audit — no model survives inconsistent tags.
- Run the causal test: Incrementality testing for ad campaigns.
FAQ
Which attribution model is most accurate? Wrong question. Accuracy depends on whether your conversion volume supports the model. A last-click report at 60 conversions a month is more trustworthy than a data-driven model at the same volume, because the second one is silently last click anyway.
How many conversions does GA4 data-driven attribution need? Roughly 300–400 per month per conversion action. Under that, GA4 falls back to last-click behaviour without changing the label on the report.
Is multi-touch attribution worth paying for? As a diagnostic for finding undercounted channels, yes, above roughly 500 stable monthly conversions and four-plus channels. As a source of causal truth, no — pair it with incrementality tests and budget for those upfront.
Should I use MTA or MMM? They answer different questions at different time horizons. MTA is tactical and identity-based; MMM is strategic and aggregate. Above meaningful scale, run both — MTA for where to look, MMM for annual allocation, incrementality to settle disputes.
What if my channels each claim the same conversions? Expected behaviour. Every platform attributes to itself. Reconcile against one internal source of truth and never sum platform-reported conversions.