 Soku AI
Most paid media "budget templates" are a table with month names across the top and channel names down the side. You fill in the numbers you already decided on, and the spreadsheet adds them up. That is not planning — it is arithmetic with extra steps.
A budget spreadsheet earns its place by answering four questions the plan itself cannot: where does the next dollar go, am I on pace today, can I survive the bad case, and is the target I set even profitable? So that is what this one does.
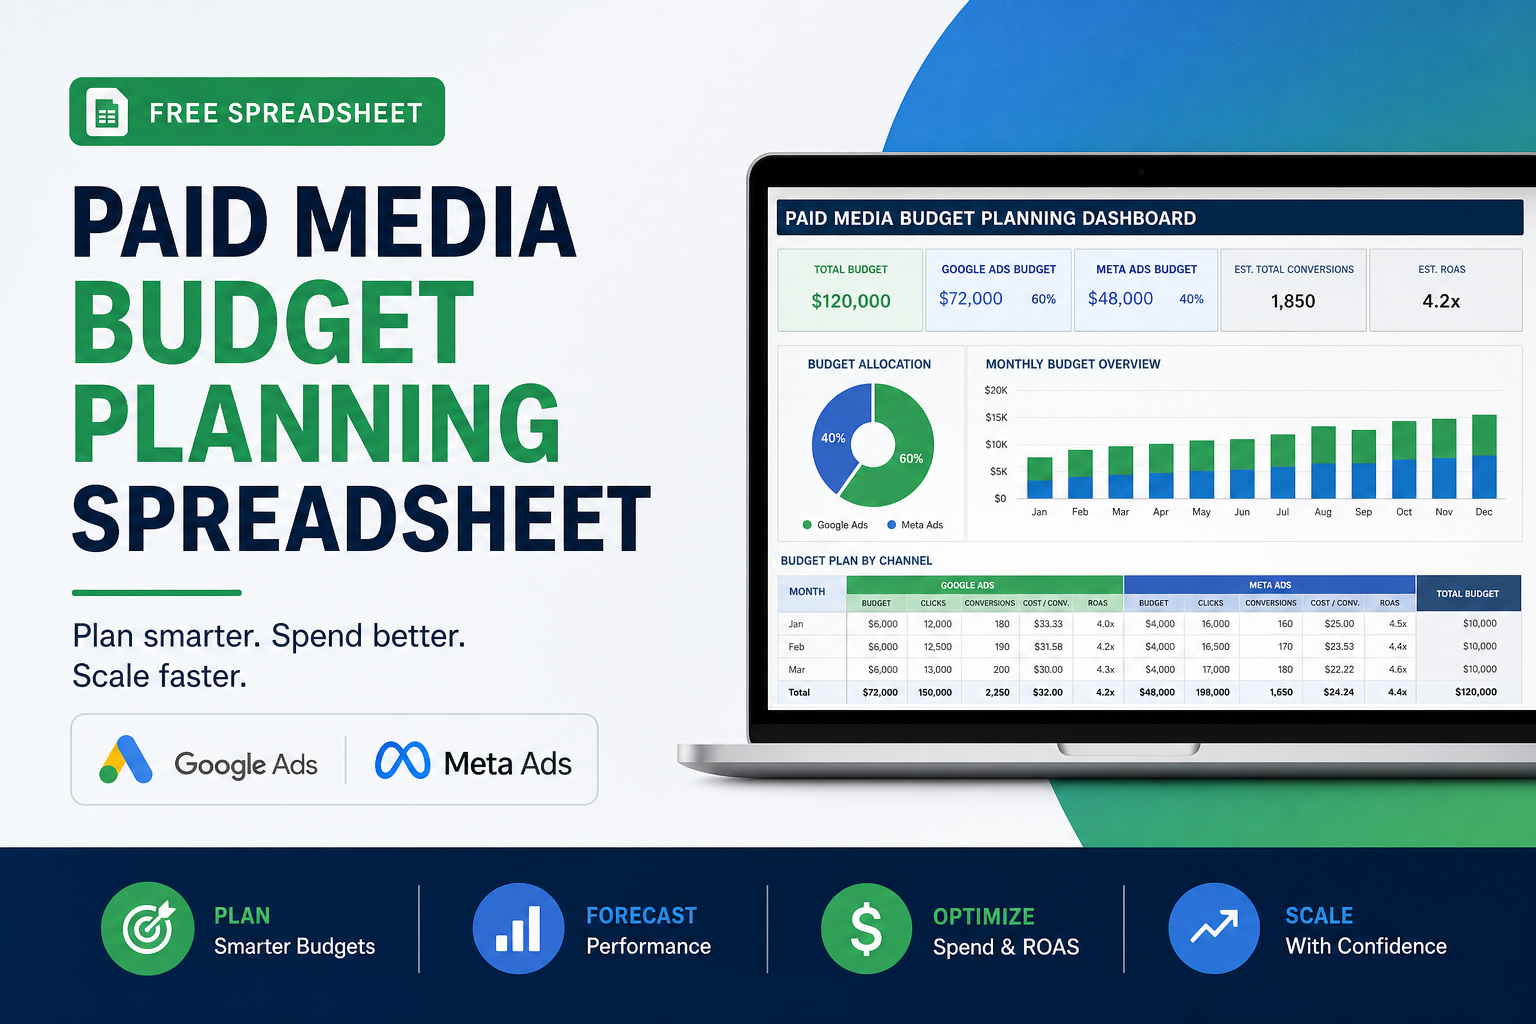
Download the workbook (.xlsx) — six tabs, live formulas, no email required. It opens in Excel, Numbers, and Google Sheets (File → Import → Upload). Everything below explains how to use it and, more importantly, the three modelling decisions baked into it that most templates get wrong.
What is in the workbook
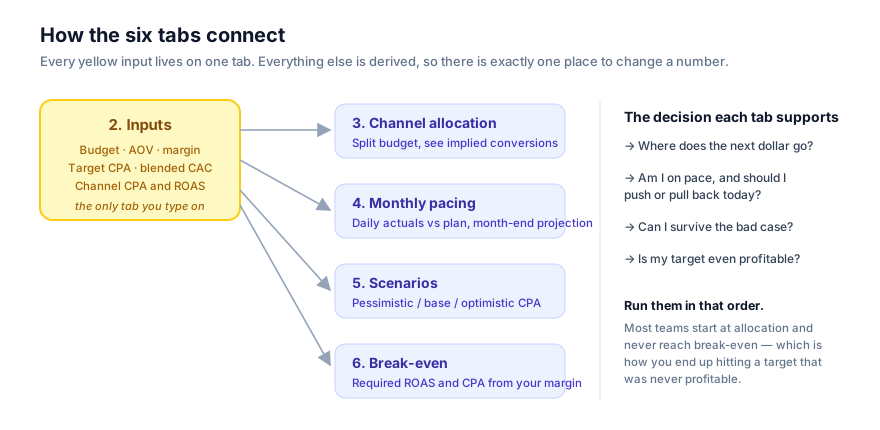
| Tab | What it does | The decision it supports |
|---|---|---|
| 1. Read me | The rules the template enforces and what it deliberately does not do | — |
| 2. Inputs | Every number you type, in one place, in yellow | — |
| 3. Channel allocation | Splits the budget across Google and Meta lines, shows implied conversions, revenue and gross profit | Where does the next dollar go? |
| 4. Monthly pacing | Daily planned vs actual cumulative spend, variance, and month-end projection | Am I on pace — push or pull back? |
| 5. Scenarios | Pessimistic / base / optimistic CPA, and profit after media in each | Can I survive the bad case? |
| 6. Break-even | Required ROAS and CPA at eleven margin levels | Is my target even profitable? |
There is exactly one tab you type on. Every other number is derived. This is not a stylistic choice — it is the single biggest reason budget spreadsheets rot. The moment the same figure exists in three tabs, they drift, and within two months nobody trusts any of them.
Three modelling decisions most templates get wrong
1. Plan in conversions, not in spend
Spend is the input. Conversions are the goal. A plan that says "$40,000 across Google and Meta" has not committed to anything you can be wrong about. A plan that says "$40,000 to buy 1,000 conversions at $40" has, and it will tell you in week two whether it is working.
The Inputs tab derives target conversions from budget ÷ target CPA, and the allocation tab carries that logic down to each channel line. If you cannot fill in a target CPA, you do not have a budget yet — you have an allocation.
2. Never plan to a single CPA
Your base case will be wrong. That is not pessimism, it is the base rate: CPA moves with seasonality, auction pressure, creative fatigue and your own conversion rate, and none of those are stable over a quarter.
The scenarios tab models three worlds — CPA 35% worse, as planned, and 20% better — and the number that matters is profit after media in the pessimistic row. If that figure is deeply negative and you cannot fund it for a quarter, the problem is that the budget is too large, not that the CPA target is too soft. This is a distinction most teams only make after the fact.
The optimistic row is not decoration either. If CPA comes in 20% better, where does the extra budget go? Deciding that in advance is the difference between scaling deliberately and scaling by accident.
3. Break-even ROAS comes from your margin, not a benchmark
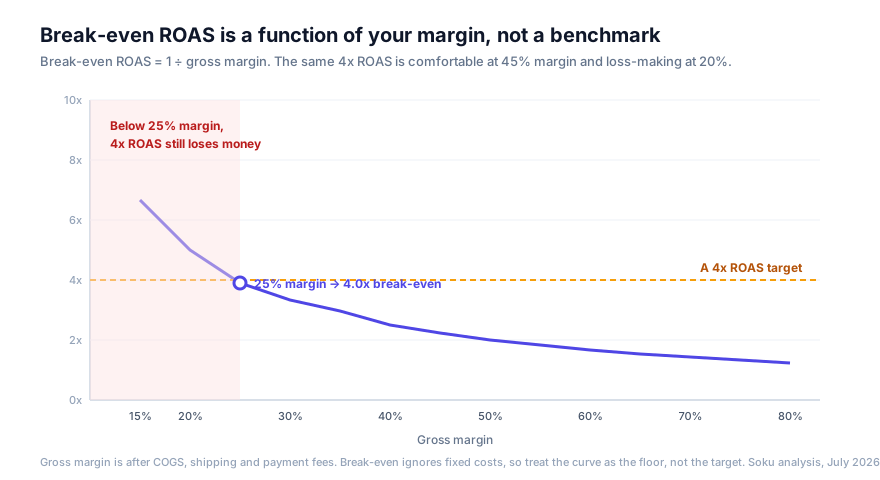
This is the most common and most expensive error in paid media planning. Someone reads that a "good ROAS is 4x", sets 4x as the target, hits it, and loses money.
The arithmetic is unforgiving:
Break-even ROAS = 1 ÷ gross margin
At 45% gross margin, break-even is 2.2x, and a 4x ROAS is genuinely healthy. At 25% margin, break-even is exactly 4.0x — that celebrated 4x ROAS returns precisely zero gross profit. At 20% margin, break-even is 5.0x, and 4x is a loss on every order.
The equivalent for lead generation:
Break-even CPA = AOV × gross margin
At a $120 AOV and 45% margin, break-even CPA is $54. Any CPA below that produces gross profit; anything above it does not, regardless of what the industry benchmark says.
Tab 6 tabulates both across eleven margin levels so you can find your row. One honest caveat printed on the tab: break-even ignores fixed costs. Your rent, salaries and tooling are not in this number, which is why break-even is a floor, not a target. The last column shows the ROAS you would need for a 20% net margin, and for low-margin businesses it returns an absurd figure — which is itself the answer: that margin cannot support a 20% net margin from paid media at any ROAS.
Using the allocation tab
The allocation tab ships with a six-line default split that is a reasonable starting point for an ecommerce account, not a recommendation:
| Line | Default split | Why |
|---|---|---|
| Google Ads — Brand | 8% | Cheap, high-converting, and mostly demand you already created. Necessary, not growth. |
| Google Ads — Non-brand Search | 27% | The genuine incremental search demand. Usually the most defensible line in the plan. |
| Google Ads — PMax / Shopping | 20% | Volume, at the cost of visibility. Exclude brand terms or this line quietly cannibalises row one. |
| Meta — Prospecting | 25% | Where new demand actually gets created. The line most often underfunded. |
| Meta — Retargeting | 10% | Efficient on platform-reported numbers, heavily overlapping with organic conversion. |
| Test reserve | 10% | New creative, new channels, new offers. Protect it. |
Two guardrails worth stating outright.
Retargeting above ~15% is usually a measurement artifact, not a strategy. Retargeting reports beautiful ROAS because it is being credited with conversions from people who were already going to buy. If retargeting is your best-performing line and it keeps growing, the honest test is a holdout: turn it off for two weeks in one geography and see whether total revenue moves.
Brand search is a defensive line, not a growth line. It belongs in the plan, and its excellent ROAS should never be averaged into a growth conversation. The allocation tab keeps it on a separate row for exactly this reason.
And the test reserve is the first thing to get raided and the last thing you should raid. Ten percent of $40,000 is $4,000 a month — the only budget in the plan capable of finding your next winning creative angle. A quarter spent fully optimising the lines you already have is a quarter with no new inputs.
Using the pacing tab
Enter actual spend once a day. The tab computes cumulative actual against a straight-line plan, the variance, the percentage pace, and a projected month-end total.
Two rules are printed on the tab and both are learned the hard way:
Do not act on pace variance before day 7. Daily spend is noisy — delivery ramps, auctions fluctuate, weekends behave differently. Steering on day 3 data means over-steering, and every correction resets what the bidding algorithm has learned.
If you are more than 10% over by day 10, cut daily budgets rather than pausing campaigns. Pausing resets learning and you pay for the ramp-up twice. Reducing daily budgets throttles spend while keeping the campaign in market and its learning intact.
One deliberate simplification: the plan line is straight-line, not seasonally weighted. If your business has a known intra-month shape — a payday spike, a month-end B2B push — override column B with your own curve. A straight line is the right default precisely because most teams do not actually know their shape and inventing one is worse than admitting it.
The measurement caveat, stated up front
The Inputs tab asks for blended CAC alongside the platform-reported CPAs, and derives the gap between them. This is deliberate and it is the most useful number in the workbook.
Google and Meta both claim conversions using their own attribution models and lookback windows, and those claims overlap. If Google reports a $38 CPA and Meta reports $44, but your total marketing spend divided by new customers is $46, the platforms are double-counting somewhere and your real efficiency is worse than either dashboard says.
Use platform numbers for relative decisions inside a channel — which campaign, which ad set, which creative. Use blended CAC for absolute decisions about total budget. Mixing the two is how a plan that looks profitable in two dashboards produces a P&L that does not.
The workbook does not attempt to model attribution, and no spreadsheet honestly can. What it does is put the discrepancy in front of you every time you plan, rather than letting it hide.
Using this in Google Sheets
The file is .xlsx with standard formulas — SUM, AVERAGE, IF, MIN, N — all of which Sheets supports natively.
- Download the workbook.
- In Google Sheets: File → Import → Upload, then choose Replace spreadsheet or Create new spreadsheet.
- Currency formats sometimes need re-applying after import (Format → Number → Currency). Formulas carry over intact.
When a spreadsheet stops being the right tool
Honest limits, since we are giving this away rather than selling it.
A spreadsheet is excellent at planning and poor at operating. Manual daily entry into the pacing tab works for one or two accounts and quietly stops happening at five. The other structural limit: a spreadsheet only knows what you typed into it. It cannot tell you that Meta prospecting CPA rose 30% because a single creative fatigued, or that Google PMax started absorbing brand queries.
The rough dividing line: under three accounts, a spreadsheet plus fifteen minutes a day is genuinely fine. Above that, the entry cost exceeds the value and you want the actuals arriving automatically.
Soku AI connects to Google Ads and Meta and pulls the actuals continuously, so pacing, channel efficiency and anomalies are read from the accounts rather than typed in — and it explains why a number moved rather than just showing that it did. But plan in the spreadsheet first. The thinking in tabs 5 and 6 — what happens in the bad case, and what ROAS your margin actually requires — is yours to do, and no tool should do it for you.
For the pricing side of the same planning conversation, see Meta ads management pricing and Google Ads automation pricing, which cover what management and tooling add on top of the media budget in this workbook.
FAQ
Is this budget template really free?
Yes. Direct download, no email gate, no account. It is an .xlsx file with live formulas.
Does it work in Google Sheets?
Yes — File → Import → Upload. All formulas used are Sheets-compatible. You may need to re-apply currency formatting after import.
How do I calculate my paid media budget from a revenue target?
Work backwards. Revenue target ÷ AOV = orders needed. Orders needed × target CPA = media budget. Then check that target CPA against tab 6 — if it exceeds AOV × gross margin, the target is not profitable at any volume and something upstream has to change.
What is a good ROAS?
There is no such number independent of your margin. Break-even ROAS is 1 ÷ gross margin: 2.2x at 45% margin, 4.0x at 25%, 5.0x at 20%. A "good" ROAS is comfortably above your break-even, and tab 6 tells you where that is.
How much budget should I hold back for testing?
Ten percent is a defensible default and the workbook uses it. Below 5% you stop generating new inputs; above 20% you are underfunding what already works. The reserve should be spent, not banked — an unspent test reserve is a test you did not run.
Should I split budget evenly between Google and Meta?
No. Split by role. Google captures existing demand, Meta creates it. The right ratio depends on how much demand for your category already exists — a well-known product skews to Search, a new category skews to social. Start from the default split, then move budget based on incremental results rather than platform-reported ROAS.
How often should I update the pacing tab?
Daily, but only act on it after day 7. Before then daily variance is noise and correcting for it resets your campaigns' learning.
Why does the template ask for blended CAC as well as platform CPA?
Because they disagree, and the gap is information. Platforms claim overlapping conversions. Use platform numbers to compare campaigns within a channel; use blended CAC to decide total budget.