 Soku AI
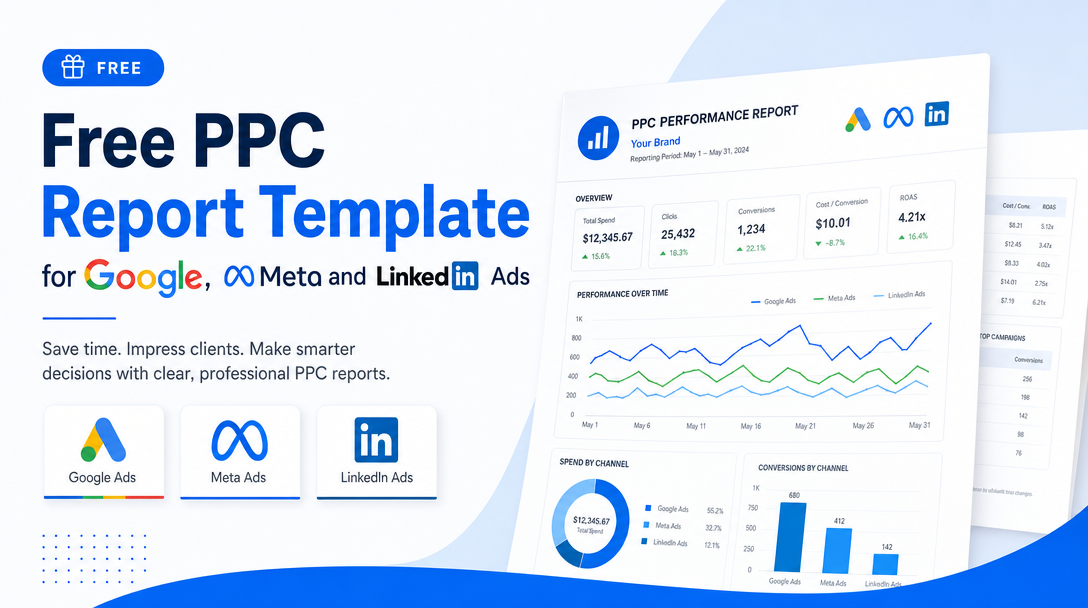
Most PPC reports fail in the same way. They are a data dump — every metric each platform offers, stacked into a spreadsheet, delivered on time and read by nobody. The stakeholder skims for the one number they care about, does not find it, and asks the question over email anyway.
A report is not a data export. It is an argument that answers a small number of questions, and everything that does not serve one of those questions is making the argument harder to hear. This template starts from the questions.
The four questions a cross-channel report must answer
- Did we spend what we said we would? Pacing against budget, per channel and in total.
- What did the money produce? Conversions and revenue or pipeline, at what cost.
- What changed, and why? The movement since last period, with a cause attached — not just an arrow.
- What are we doing next, and what do we need? Specific actions, with the decision you need from the reader.
If a metric on your report does not serve one of those four, it is decoration. That test alone usually removes a third of a typical report.
The two views, and why one is not enough
A single report cannot serve both audiences, because the people running the account and the people funding it need different time horizons and different granularity. Trying to merge them produces something too detailed for the executive and too shallow for the operator.
View 1 — the weekly operating report. Audience: whoever manages the account, plus the marketing lead. Granularity: campaign level. Purpose: catch problems while they are still cheap. Compares this week to last week and to the trailing four-week average.
View 2 — the monthly business report. Audience: the client, the CFO, the executive team. Granularity: channel level only. Purpose: answer whether the programme is working and what to fund next. Compares this month to last month and to the same month last year where you have the history.
Keep them as separate documents. A monthly report that is twelve weekly reports concatenated is not a monthly report.
What to pull from each platform
The metrics below are the ones that survive the "does it answer one of the four questions" test. Names differ slightly per platform; the concepts do not.
Google Ads: cost, impressions, clicks, CTR, average CPC, conversions, conversion value, cost per conversion, conversion rate, search impression share, and search lost IS (budget) plus search lost IS (rank).
Those last two are the ones teams skip and should not. Lost impression share to budget is the only metric on the list that directly answers "would more money help?" — if you are losing 40% of available impressions because your budget ran out, the answer is yes and you can quantify it. Lost IS to rank tells you the opposite: the problem is relevance or bid, and more budget will not fix it.
Meta Ads: amount spent, impressions, reach, frequency, link clicks, CTR (link), CPM, results and cost per result, and your primary conversion event with its value.
Use link clicks, not "clicks (all)", which includes reactions and profile taps and will inflate your CTR into meaninglessness. Include frequency: it is the earliest reliable warning of creative fatigue, and reading it alongside CTR turns a delivery metric into a diagnosis. Our guide to reach, impressions and frequency covers what those three actually tell you together.
LinkedIn Ads: spend, impressions, clicks, CTR, average CPC and CPM, leads and cost per lead, lead form completion rate, and conversions if you have the Insight Tag configured.
LinkedIn's economics are different enough that comparing its CPC to Google's is not informative. Report it against its own history and against pipeline value, not against the other channels' unit costs.
The derived columns worth calculating
Platforms give you the raw numbers. These are the ones you compute, and they are where the reporting value actually is:
| Column | Formula | What it answers |
|---|---|---|
| Budget pacing % | Spend to date ÷ (budget × days elapsed ÷ days in period) | Are we on track, ahead, or behind |
| Cost per unique reach | Spend ÷ reach | What a new person costs (Meta) |
| Blended CPA | Total spend ÷ total conversions, all channels | The number the business actually feels |
| Contribution | Revenue × margin − spend | Whether this made money |
| Week-over-week delta % | (This − last) ÷ last | Direction, at a glance |
| Share of spend | Channel spend ÷ total spend | How the mix is shifting |
Budget pacing is the single highest-value derived column and the one most often missing. "We spent $47,300" means nothing on its own. "We spent $47,300 against a $52,000 pace, 9% behind, because two campaigns were budget-capped on the 8th" is a report.
The metrics to deliberately leave out
Cutting is harder than adding, so here is an explicit list.
Never sum reach across platforms. Meta's reach and LinkedIn's reach both count unique people as far as each platform can tell, and neither knows about the other. Adding them double-counts everyone on both. Report reach per platform, labelled per platform, and never in a total row.
Do not sum platform-reported conversions across channels either, or if you do, label the total explicitly as double-counted. When one purchase is claimed by both Google and Meta, your cross-channel conversion total exceeds the number of orders in your own system — and a stakeholder who compares your report to the order count will lose confidence in the entire document.
Drop impression counts from the executive view. Impressions belong in the weekly operating report as a delivery diagnostic. In the monthly business report, they invite the wrong conversation.
Drop any metric you have never once acted on. Quality Score, average position equivalents, engagement rate — if no decision in the past year turned on it, it is costing attention and returning nothing.
The reconciliation note that makes the report trustworthy
This is the paragraph that separates a professional report from a spreadsheet, and it belongs on the monthly view every single time:
Platform-reported conversions are counted independently by each platform and may include the same conversion more than once. Our own recorded orders for this period: N. The gap is expected and is a function of how attribution works, not an error.
Put your actual system-of-record number next to the platform numbers. Every time. It pre-empts the most damaging question a stakeholder can ask three months in — "why does this not match our sales figures?" — by answering it before it is asked, in your framing rather than theirs.
For the same reason, the monthly report should carry one blended efficiency number that does not depend on attribution at all. MER — total revenue ÷ total marketing spend) — is the honest cross-channel efficiency figure, and it belongs at the top of the business view precisely because no platform can inflate it. If you want to understand why the platform totals and the blended number diverge as much as they do, multi-touch attribution models compared works through the mechanics.
The template, section by section
Monthly business report:
- Headline — three numbers only: total spend, total revenue or pipeline, MER. Plus one sentence stating whether the month was ahead of, on, or behind plan.
- Channel summary — one row per channel: spend, share of spend, conversions, CPA, platform ROAS, month-over-month delta. Reach omitted or clearly per-channel.
- What changed — three to five bullets, each pairing a movement with a cause. "CPA rose 18% on Meta" is not a bullet. "CPA rose 18% on Meta after the top-performing creative fatigued in week 3 — frequency reached 5.2 and CTR fell 40%; three replacements launched on the 22nd" is.
- Reconciliation note — as above, with your own order or lead count.
- Next period — what you will do, what you need approved, and what you expect it to change.
Weekly operating report:
- Pacing table — campaign level, spend to date, pace target, variance, with anything more than 10% off flagged.
- Movers — the five campaigns with the largest week-over-week change in spend or CPA, in either direction.
- Delivery diagnostics — frequency and CTR trend on Meta, lost impression share on Google.
- Actions taken this week — a running log, dated. This is the section that saves you six months from now when someone asks why performance shifted in August.
Making it maintainable
The template is the easy part. What kills reporting is that assembling it takes three hours every Monday, so it degrades into a copy-paste of last week with the numbers changed.
Two things keep it alive. First, a naming convention that lets you group campaigns by funnel stage, market and offer without hand-tagging — a report that can only be built by someone who remembers what each campaign was for is a report with a single point of failure. Our campaign naming convention template covers the taxonomy, and UTM naming conventions covers the analytics side.
Second, pull the data automatically. Any exercise that requires logging into three interfaces and exporting three CSVs will be skipped the first busy week, and once skipped it rarely returns. If you are evaluating what to use, our roundup of PPC reporting tools for agencies compares the options, and the Facebook Ads reporting template covers the Meta-only case in more depth.
Where to go next
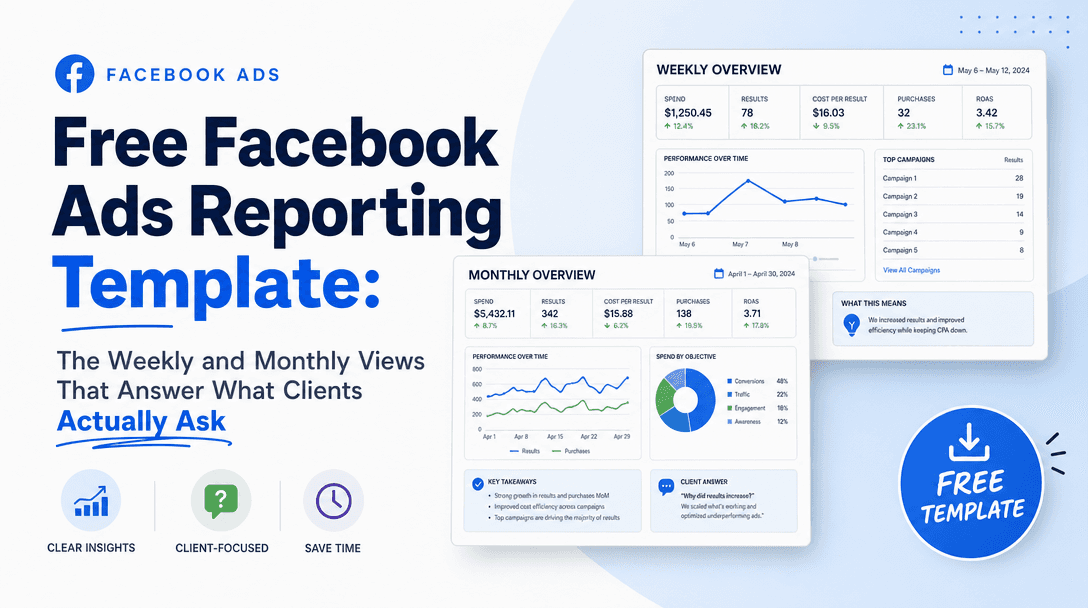
- Facebook Ads reporting template — the Meta-specific version of these two views.
- MER vs ROAS — the blended efficiency number that belongs at the top of the monthly report.
- Reach vs impressions vs frequency — why reach must never be summed.
- Campaign naming convention template — what makes cross-channel grouping possible at all.
- Best PPC reporting tools for agencies — automating the assembly.
FAQ
What should a PPC report include?
Spend and pacing against budget, conversions and cost per conversion, the change since last period with causes attached, and the actions planned next. Everything else is optional and most of it is noise.
How often should I send a PPC report?
Two cadences, two documents. A weekly operating report at campaign level for the people running the account, and a monthly business report at channel level for the people funding it.
Can I combine Google, Meta and LinkedIn metrics into one total?
Spend, impressions and clicks can be summed. Reach cannot, because each platform deduplicates only within itself. Conversions can be summed only with an explicit note that platforms count independently and may claim the same conversion more than once.
Which metrics should I leave out of a client report?
Anything you have never acted on. In practice that usually means impressions in the executive view, Quality Score, engagement rate, and any platform-specific index nobody can define without looking it up.
Why do my platform conversions exceed my actual orders?
Because each platform counts conversions it observed, under its own attribution window, and none of them subtract each other. One order touched by two platforms is counted twice. Always show your own system-of-record number alongside.
What is the single most useful column to add?
Budget pacing percentage. It converts "we spent this much" into "we are ahead or behind, by this much, for this reason", which is the only spend statement anyone can act on.