 Soku AI
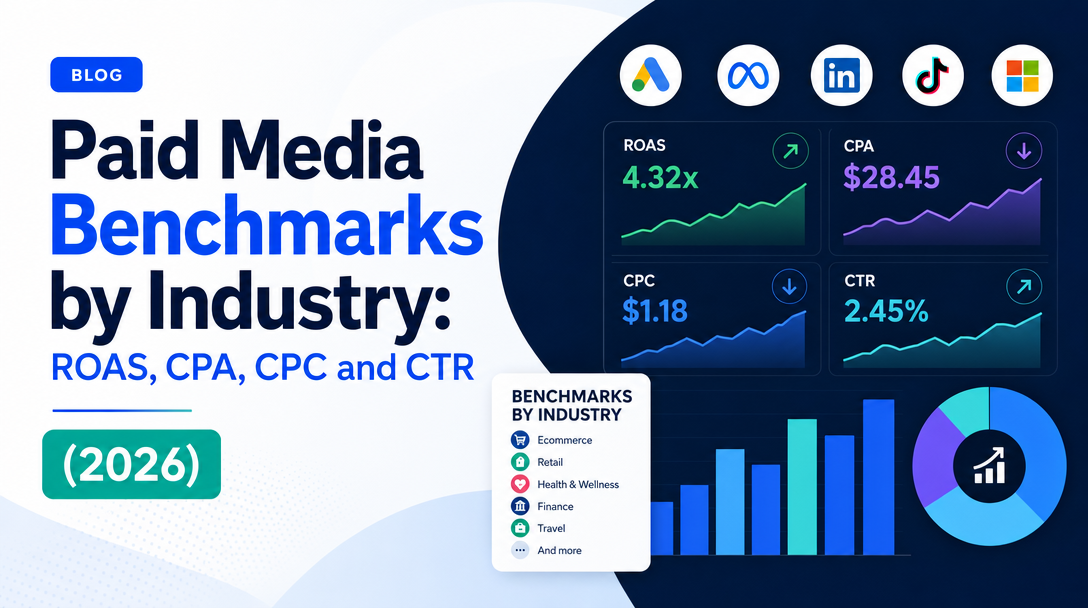
Search "paid media benchmarks by industry" and you will get two dozen pages of tidy tables. Almost none of them tell you where the numbers came from. Trace any one figure back three hops and it usually dissolves: page A cites page B, page B cites "industry data," page C cites a 2019 report that no longer exists. The numbers get copied, rounded, re-typed, and eventually quoted back to you in a board deck as if they were measured.
This page is built the opposite way. Every figure below carries four things: the named source, the period it covers, the sample the source disclosed, and a caveat about what it cannot be compared to. Where we could not establish all four, the number is not here — and we list what we threw out at the end, so you can see the shape of the hole.
That makes this table shorter than the ones you will find elsewhere. It is also the only version of it we would be willing to defend line by line.
Read this before you read a single number
Cross-source benchmark comparison is methodologically shaky, and pretending otherwise is the original sin of every benchmark listicle. Six specific things break comparability, and all six are usually invisible in the table you are reading:
1. The sampling frame is not the market. Every third-party benchmark is a sample of one vendor's customers. WordStream's data is drawn from accounts managed on LocaliQ's platform — heavily SMB, heavily US, heavily lead-gen. Unbounce's data is landing pages built in Unbounce. IRP's is stores running on the IRP platform. None of them is a random sample of advertisers, and none of them claims to be. A "Finance & Insurance" median from an SMB-weighted panel is not the number a national insurer will see.
2. "Average" usually means median, and sometimes means neither. WordStream states plainly that its "averages are technically median figures to account for outliers." Databox reports medians. Many aggregator tables report a mean, or a blend, or do not say. Medians and means diverge violently on ad metrics, which are heavily right-skewed — a handful of $80 CPC legal keywords will drag a mean far above the number a typical advertiser experiences.
3. Metric definitions are not standardized. "Conversion rate" can be per click, per session, or per user. Unbounce measures conversions per landing-page visitor. IRP Commerce measures transactions ÷ sessions. Google Ads measures conversions ÷ clicks, counting whatever conversion actions you happened to import. These are three different denominators wearing the same name.
4. Attribution windows silently rewrite every ROAS and CPA figure. A 7-day-click / 1-day-view Meta ROAS and a 28-day-click ROAS from the same account, the same week, can differ by 40% or more. Almost no published benchmark states its window. IRP's data is explicitly last-click; most others say nothing at all.
5. Date ranges rarely line up. A 2026 table quoting a figure measured in 2023 is not wrong, but it is describing a different auction. Meta's own reporting shows the average price per ad rose 12% year over year in Q1 2026 alone — anything two years stale is off by a compounding margin before you account for anything else.
6. Industry taxonomies are invented per-vendor. "Business Services" in one dataset overlaps "Industrial & Commercial," "Career & Employment," and "Finance" in another. There is no shared classification, so a row-to-row comparison between two studies is comparing two different definitions of the same word.
The practical consequence: use a published benchmark to size an order of magnitude and to sanity-check a direction of travel. Never use one as a target. Your target comes from your own margin structure, which we get to below.
The provenance ladder
Not all benchmark sources are equally bad. They fail in different, predictable ways, and it helps to sort them into tiers before you decide how much weight to give a number.
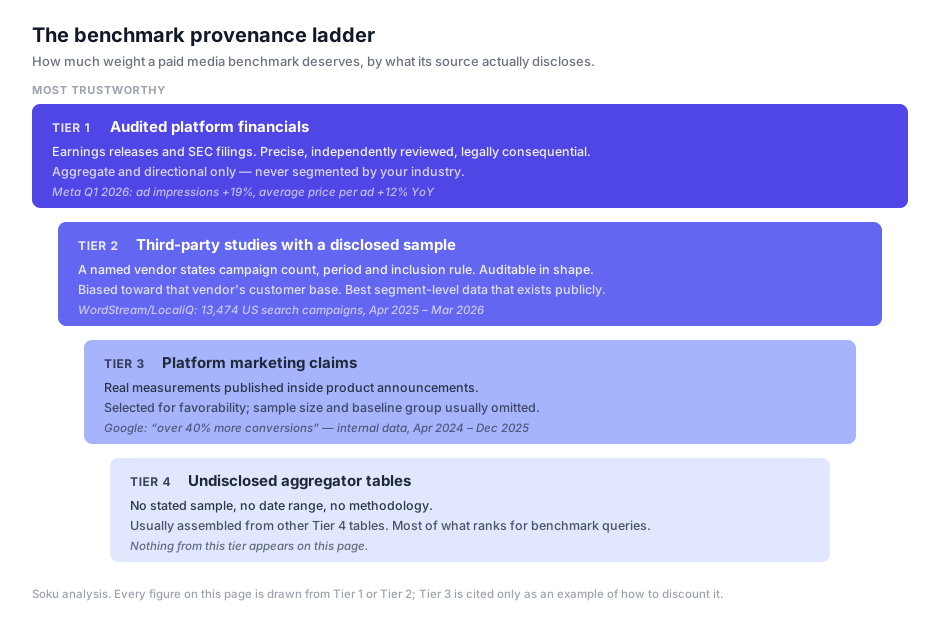
Tier 1 — Audited platform financials. Numbers in an earnings release or SEC filing. Independently reviewed, precisely defined, legally consequential if wrong. The catch: they are aggregate and directional (price per ad, impression growth), never segmented by your industry. They tell you which way the auction is moving, not what you should pay.
Tier 2 — Third-party studies with a disclosed sample. A named vendor states how many campaigns, over what period, with what inclusion rule. Biased by the vendor's customer base, but auditable and reproducible in shape. This is the best segment-level data that exists publicly.
Tier 3 — Platform marketing claims. Google, Meta and TikTok publish performance lifts in product announcements. These are real measurements, but they are selected for favorability, rarely state a sample size, and often omit the baseline group. Useful as evidence a feature works at all; useless as a planning number.
Tier 4 — Undisclosed aggregators. A table with no stated sample, no date range, and no methodology, often assembled from other tables in the same tier. This is the bulk of what ranks for benchmark queries. We publish none of it.
Tier 1: what the platforms actually disclose
Meta is the only major ad platform that reports auction-level price movement in an audited financial statement, and it reports exactly two numbers.
| Metric | Q1 2026 value | Source | Period | Sample / scope | Caveat |
|---|---|---|---|---|---|
| Ad impressions delivered, YoY change | +19% | Meta Q1 2026 results, released 29 Apr 2026 | Q1 2026 vs Q1 2025 | All Family of Apps inventory, global | Global blend; mix-shifted by fast growth in low-monetizing regions |
| Average price per ad, YoY change | +12% | Meta Q1 2026 results, released 29 Apr 2026 | Q1 2026 vs Q1 2025 | All Family of Apps inventory, global | Not a CPM you can budget against — it is a revenue-per-ad blend across every objective, placement and country |
| Advertising revenue | $55.02B | Meta Q1 2026 results, released 29 Apr 2026 | Q1 2026 | Consolidated | Context only; not a benchmark |
What this is good for: establishing that Meta inventory got roughly 12% more expensive year over year while volume grew 19%. That is a real, audited, dated fact, and it is the correct thing to cite when someone asks why CPMs are up. What it is not good for: any statement beginning "the average Meta CPM for e-commerce is…". Meta does not publish that, and neither does Google, TikTok or LinkedIn. No major ad platform publishes industry-segmented CPM, CPA, CTR or ROAS benchmarks. Every table you have seen that claims to is Tier 2 at best.
Tier 2: search benchmarks by industry (Google Ads + Microsoft Ads)
This is the single best-documented industry benchmark dataset in paid media, and it is the backbone of this page.
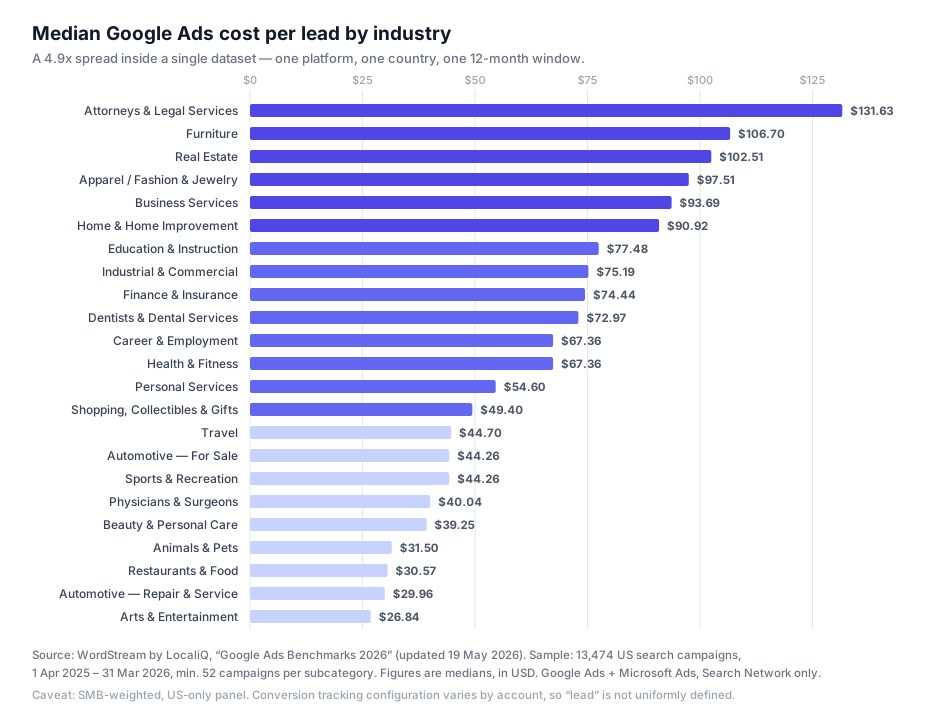
Provenance block. Source: WordStream by LocaliQ, "Google Ads Benchmarks 2026", last updated 19 May 2026. Sample: 13,474 US-based search advertising campaigns across 23 industries, with a minimum of 52 unique active campaigns per subcategory. Period: 1 April 2025 – 31 March 2026. Platforms: Google Ads and Microsoft Ads, Search Network only. Statistic: medians, published under the label "average," in USD. LocaliQ republishes the identical dataset on its own benchmarks page (last updated 1 June 2026) — WordStream is a LocaliQ property, so treat those two URLs as one source, not two corroborating ones.
| Industry | Avg CTR | Avg CPC | Avg conv. rate | Avg cost per lead |
|---|---|---|---|---|
| Animals & Pets | 7.49% | $4.06 | 16.22% | $31.50 |
| Apparel / Fashion & Jewelry | 6.64% | $4.44 | 4.50% | $97.51 |
| Arts & Entertainment | 12.75% | $1.63 | 5.91% | $26.84 |
| Attorneys & Legal Services | 5.87% | $9.87 | 5.55% | $131.63 |
| Automotive — For Sale | 8.28% | $2.27 | 6.01% | $44.26 |
| Automotive — Repair, Service & Parts | 5.56% | $4.35 | 15.51% | $29.96 |
| Beauty & Personal Care | 6.75% | $4.62 | 10.35% | $39.25 |
| Business Services | 6.10% | $5.87 | 4.85% | $93.69 |
| Career & Employment | 5.88% | $5.81 | 3.05% | $67.36 |
| Dentists & Dental Services | 5.66% | $8.00 | 10.67% | $72.97 |
| Education & Instruction | 7.56% | $4.81 | 13.14% | $77.48 |
| Finance & Insurance | 9.83% | $3.39 | 2.64% | $74.44 |
| Furniture | 6.57% | $3.97 | 2.99% | $106.70 |
| Health & Fitness | 5.81% | $6.17 | 6.94% | $67.36 |
| Home & Home Improvement | 6.47% | $8.33 | 8.05% | $90.92 |
| Industrial & Commercial | 6.57% | $5.87 | 8.20% | $75.19 |
| Personal Services | 7.16% | $7.17 | 12.34% | $54.60 |
| Physicians & Surgeons | 6.61% | $4.76 | 12.43% | $40.04 |
| Real Estate | 7.61% | $3.22 | 3.70% | $102.51 |
| Restaurants & Food | 6.83% | $2.05 | 8.05% | $30.57 |
| Shopping, Collectibles & Gifts | 8.28% | $4.14 | 4.01% | $49.40 |
| Sports & Recreation | 8.75% | $2.77 | 7.69% | $44.26 |
| Travel | 9.32% | $2.14 | 5.83% | $44.70 |
| All industries | 6.64% | $5.42 | 8.18% | $66.69 |
Note the internal oddity in the all-industry row: the blended CPC of $5.42 sits above 15 of the 23 industry medians, and the blended conversion rate of 8.18% sits above 15 of them too. That is what happens when you take a median across a differently-weighted pool rather than averaging the rows — a useful reminder that even inside one clean dataset, two figures both labeled "average" are not arithmetically reconcilable.
How to read this table without misusing it
- It is search only. Nothing here transfers to Meta, TikTok, YouTube or retail media, where the buying model, the intent and the creative unit are all different.
- It is US only, in USD. UK, EU and APAC auctions price differently and the currency is not the main reason.
- Conversion rate here is conversions ÷ clicks as counted in the ad platform, which means it inherits every quirk of how those 13,474 accounts configured conversion tracking. Accounts that import a soft "page view" conversion will show a conversion rate several times higher than accounts importing only qualified leads.
- Cost per lead is a lead, not a customer. For most B2B and considered-purchase categories, the number you actually need is cost per qualified opportunity, which is this figure divided by a lead-quality rate you have to measure yourself.
- The panel skews SMB. If you run eight figures of search spend, treat these as the bottom of your comparison set, not the middle.
The most useful thing in the table is not any single row — it is the spread. Within one platform, one country, one twelve-month window and one consistently-applied methodology, median cost per lead ranges from $26.84 to $131.63. That is a 4.9x range with every other variable held constant.
Landing page conversion rate by industry
Provenance block. Source: Unbounce, "What is the average landing page conversion rate?", page updated 4 March 2025. Sample: 41,000 landing pages, 464 million visitors, 57 million conversions. Period: Q4 2024. Statistic: median — Unbounce explicitly notes it uses the median because "averages are susceptible to skewing when extreme outliers exist."
The headline figure is a 6.6% median conversion rate across all industries. Unbounce's own caveat is the important part and we will quote it rather than paraphrase: "the true definition of good will vary significantly from one industry to the next — and even one landing page to the next."
Two comparability warnings that matter more than the number:
- Unbounce's denominator is landing page visitors, not ad clicks. Click-to-visit loss (bounces before page load, bot filtering, tracking-parameter drops) sits between your ad platform's click count and Unbounce's visit count, so a 6.6% Unbounce conversion rate and a 6.6% Google Ads conversion rate are not the same event ratio.
- A "conversion" in this dataset is whatever the page owner defined — a newsletter signup and a $40,000 demo request are both counted as one. The 6.6% is therefore an average over wildly different offer difficulties, which is exactly why the per-industry cut moves so much.
We have deliberately not reproduced Unbounce's per-industry breakdown here: the full segmentation lives in the gated Conversion Benchmark Report, and we do not publish figures we have not read at the source. The all-industry median above is stated on the public page and is the part we can stand behind.
E-commerce: the definitional trap in "CPA"
Provenance block. Source: IRP Commerce Ecommerce Market Data, June 2026 edition. Sample: first-party operational trading data recorded on the IRP platform, a UK/Ireland-weighted merchant base. Period: June 2026 vs June 2025. Attribution: last click. This page is refreshed monthly, so the figures below are a snapshot and will not match the live page later.
| Metric | June 2026 | YoY change | Definition IRP uses |
|---|---|---|---|
| Conversion rate | 2.03% | +9.74% | Transactions ÷ sessions × 100 |
| Average order value | £127.06 | +2.31% | — |
| "Cost per acquisition" | 9.34% | +17.78% | Marketing cost ÷ revenue × 100 |
| Sales growth | +13.48% | −40.54% | — |
Look at the third row carefully. IRP labels it "Cost Per Acquisition" but defines it as marketing cost as a percentage of revenue — that is a marketing efficiency ratio, not a cost per acquisition at all. Inverted, 9.34% implies a blended MER of roughly 10.7x, which is a completely different statement from "CPA is 9.34."
This is the single clearest example on this page of why benchmark tables cannot be safely merged. If an aggregator scrapes that row into a "CPA benchmarks by industry" table next to a $38 Meta CPA, the result is nonsense — and that is precisely how most of those tables get built. Two published numbers sharing a label is not evidence they measure the same thing.
The two comparable figures are also worth reading against your own: a 2.03% session-level conversion rate is a sessions denominator on a UK-weighted, last-click, platform-specific merchant panel. Compare it to your own GA4 session conversion rate on the same attribution model or not at all.
Case study in disagreement: two sources, one platform, 4.3x apart
To show how large the methodology effect is, here are the only two Google Ads benchmark datasets we found that both name a source and state what statistic they report. They describe the same platform. They do not agree on anything.
| Metric (all industries) | WordStream by LocaliQ | Databox |
|---|---|---|
| Median CPC | $5.42 | $1.27 |
| Median CTR | 6.64% | 3.94% |
| Median conversion rate | 8.18% | 3.42% |
| Period measured | Apr 2025 – Mar 2026 | May 2023 |
| Disclosed sample | 13,474 US search campaigns, min. 52 per subcategory | Not disclosed |
| Statistic | Median (labeled "average") | Median |
| Scope stated | Google Ads + Microsoft Ads, Search Network, US | Google Ads, scope not stated |
Sources: WordStream by LocaliQ, updated 19 May 2026; Databox, "Google Ads Benchmarks by Industry", data collection period stated as May 2023, sample size not disclosed.
The per-industry rows diverge even harder. Databox's May 2023 median CPC for Real Estate is $0.70 against WordStream's $3.22; Automotive is $0.79 against $2.27; Education is $2.91 against $4.81.
Our reading of why — and we are labeling this as our inference, not either vendor's statement: Databox's connector pulls account-level Google Ads data that plausibly blends Search, Display and Performance Max, and Display CPCs are an order of magnitude below Search CPCs. WordStream's set is explicitly Search Network campaigns only. Layer a three-year gap on top of that and a 4.3x divergence stops being surprising. Neither source is wrong. They are answering different questions and both are titled "Google Ads benchmarks by industry."
If you have ever wondered why the benchmark you were handed did not match your account, this table is the answer. The question is almost never "which source is right."
Tier 3: platform performance claims, and how to discount them
Platforms publish numbers too, and they are worth reading with a specific kind of skepticism. Google's February 2026 Demand Gen announcement is a clean specimen. Google states that "advertisers that adopted at least 3 of the 4 Demand Gen Campaign Best Practices saw on average over 40% more conversions," attributed to Google Internal Data, Global, Apr 2024 – Dec 2025, published 24 February 2026.
Give Google credit: it names the data source and states a measurement window, which puts it ahead of most Tier 4 tables. What it does not give you is the sample size or the composition of the comparison group. And the claim is structurally self-selecting — advertisers who adopt three of four best practices are, almost by definition, better-resourced and more actively managed than those who adopt none. Some meaningful share of that "40% more conversions" is the advertiser, not the feature.
The same discount applies to every single-brand case study a platform publishes. One retailer's 50% ROAS uplift is a real thing that happened to one retailer. It is not a benchmark, and it should never be entered into a planning model.
The ROAS problem: there is no credible industry ROAS benchmark
This page is titled "ROAS, CPA, CPC and CTR," and we owe you an explanation for why there is no ROAS table on it.
We could not find a single publicly available ROAS-by-industry dataset that discloses a sample size, a date range, and an attribution window. Not one. The figures circulating — 4.21x average search ROAS, 4.84x for Performance Max, "3–4x blended for D2C, 2–3x prospecting, 6–10x retargeting" — trace back to unnamed panels or to nothing at all. We tried to source each of them and gave up.
There are structural reasons this data does not exist, and they are worth understanding because they also explain why your ROAS is not comparable to your competitor's:
- ROAS depends on conversion value tracking that every advertiser configures differently. Gross revenue, net of returns, net of discounts, first order only, LTV-weighted — all of these are entered into the same
conversion valuefield. - ROAS is attribution-window arithmetic. Widen the window and ROAS rises with no change in reality. There is no industry convention, so cross-account comparison compares configuration choices.
- ROAS is margin-blind. A 3x ROAS is spectacular at 80% gross margin and bankrupting at 25%. An industry median ROAS is therefore not even directionally useful without the industry's margin structure attached, and nobody publishes both.
- The platforms self-report it. Every ROAS you have seen is the platform grading its own homework inside its own attribution model.
Compute your break-even ROAS instead
The number you actually need is not an industry median. It is the point below which a sale loses money, and you can compute it from your own P&L in about two minutes.
Contribution margin % = (Revenue - COGS - shipping - payment fees - returns) / Revenue

Break-even ROAS = 1 / Contribution margin %

Target ROAS = Break-even ROAS / (1 - Desired contribution to overhead %)
At a 60% contribution margin, break-even ROAS is 1.67x. If you also want paid media to throw off 30% of its revenue toward overhead and profit, your target lands near 2.4x. That number is yours, it is defensible in a finance review, and it does not move when someone publishes a new listicle. The industry benchmark cannot tell you any of it.
The same logic applies to CPA. Your ceiling is contribution margin per order (or per lead, times your lead-to-close rate), not a published median from someone else's panel.
What we discarded, and why
The backlog note for this page said every number needs a source, a date, a sample and a caveat. Holding that line meant throwing out most of what we found. In the interest of showing our work, here is what did not make it:
| Figure class we found | Why it was cut |
|---|---|
| Meta CPM / CPC / CPA / CTR / ROAS by industry (18-industry tables, several sites) | Every version traced to "aggregated from Meta Ads Manager reporting, third-party analytics platforms and anonymized agency portfolio data" with no sample size, no date range and no named underlying study |
| LinkedIn Sponsored Content CPC by industry, and LinkedIn CPM ranges | Sourced through a chain of aggregators citing each other; no primary study, no disclosed account count |
| TikTok CPM by industry and placement | Multiple mutually contradictory figures ($4.80, $9.16, $3.79–$6.33) with no methodology on any of them; TikTok publishes no official benchmark set |
| Cross-platform CPM comparison table (TikTok $4–8, X $5–10, Meta $8–14, YouTube $10–18, LinkedIn $20–45) | No source at all — the most-copied table in the category and the least supported |
| Performance Max benchmarks (CPC $2.46, CVR 3.42%, ROAS 4.84x) | No named origin |
| "All-industry search ROAS 4.21x" | No named origin |
| D2C blended / prospecting / retargeting ROAS ranges | Repeated everywhere, sourced nowhere |
| Demand Gen ranges (CTR 0.5–2%, CPC $0.30–$1.50, ROAS 2–5x) | The author is refreshingly honest that these are personal observations — "here's what I'm seeing across solid ecommerce accounts right now" — with no stated sample. His own advice is the right advice: "Trust your own data, not Google's marketing claims." |
| "Insurance median CPC $900–$1,100" | Category error; almost certainly a cost-per-acquisition or per-policy figure mislabeled as CPC |
| Unbounce per-industry conversion medians | Real study, but the segmentation sits behind a gated report we did not read at source |
That is more than sixty individual figures cut, across ten classes, to keep four datasets and one platform disclosure. If a competing page shows you ten times as many numbers in half the space, that ratio is the reason — not better research.
The four-question test, for the next table you read
Before you let any benchmark into a plan, ask the source four questions. If you cannot answer all four from the page itself, close the tab.
- Who was measured? A named panel with a stated size and inclusion rule, or "industry data"?
- When? A stated window, not a "2026" in the title over a 2023 measurement.
- What exactly was counted? Which denominator, which attribution window, median or mean, which campaign types, which countries.
- What is it not comparable to? If the source never says, it has not thought about it.
WordStream, Unbounce and IRP each answer three or four of these on the public page. That is why they are on this page. Almost nothing else we read answered more than one.
The better move: benchmark against yourself
Industry benchmarks answer a question you rarely have. You almost never need to know what the median dentist pays per click. You need to know whether your CPA drifting from $54 to $71 over three weeks is seasonality, an auction shift, a creative fatigue curve, or a tracking break — and no external table can tell you that. Your own account history can, and it is the only dataset that shares your conversion definitions, your attribution window, your margin structure and your audience.
The reason most teams reach for a borrowed benchmark is that building the internal one is tedious. It means pulling multi-year history across Google, Meta and every other channel, normalizing conversion definitions across platforms that disagree about what a conversion is, segmenting by campaign type and season, and then actually watching for drift week over week. That is a standing analyst job, which is exactly why it usually does not happen.
It is also the kind of work an AI agent with direct API access to your ad accounts does well: it is high-frequency, definition-heavy, and unglamorous. Soku connects to Google Ads, Meta Ads and ChatGPT Ads, reads the full history rather than a 30-day window, and answers "is this campaign off-trend for us" against your own baseline instead of a median from someone else's customer panel. When it flags a CPA move, the comparison set is your last eight quarters, on your conversion definitions.
Three practical rules if you build this yourself instead:
- Freeze your definitions before you measure anything. One conversion action, one attribution window, applied identically across channels and quarters. A baseline built on shifting definitions is a Tier 4 table with your logo on it.
- Store percentiles, not averages. "Our P50 CPA is $54, P90 is $103" survives outliers and seasonality far better than a single mean, and it gives you an actual alerting threshold.
- Re-baseline on a schedule, not on a bad week. Quarterly is usually right. Re-baselining after every spike just launders the spike into the target.
For channel-level context on where each platform's economics differ, our ChatGPT Ads vs Google Ads vs Meta Ads comparison walks the buying models side by side, and Automating Media Buying with AI covers the operating model for running this without a full-time analyst.
FAQ
What is a good ROAS by industry in 2026?
There is no credible published answer, and anyone giving you one to two decimal places is repeating an unsourced number. Compute your break-even ROAS as 1 ÷ contribution margin, then set a target above it based on how much overhead you need paid media to carry. At a 60% contribution margin, break even is 1.67x.
What is the average CPC across all industries?
On the best-documented dataset available — WordStream by LocaliQ, 13,474 US search campaigns, April 2025 to March 2026 — the all-industry median is $5.42, and per-industry medians range from $1.63 (Arts & Entertainment) to $9.87 (Attorneys & Legal Services). That is Search Network only, US only, SMB-weighted.
Why does my CPC not match the benchmark for my industry?
Most likely because you are not in the panel that was measured. The published medians are drawn from one vendor's customer base, in one country, over one window, on one set of campaign types. Geography, campaign mix, brand-versus-nonbrand share and account size each move CPC more than industry does.
Do Google, Meta, TikTok or LinkedIn publish official benchmarks?
No. None of them publishes industry-segmented CPM, CPC, CPA, CTR or ROAS benchmarks. Meta discloses aggregate ad impression growth and average price-per-ad change in its quarterly results, and Google publishes selected performance lifts in product announcements. Every industry-level table you have seen comes from a third party.
Is a 6.6% conversion rate good?
It is the Q4 2024 median across 41,000 Unbounce landing pages, and Unbounce itself warns that "good" varies enormously by industry and by page. A 6.6% rate on a newsletter signup is weak; on an enterprise demo request it would be exceptional. Compare against your own historical rate on the same offer type.
Maintenance note
This page is maintained as a reference, not published and abandoned. Current as of 24 July 2026. The WordStream/LocaliQ dataset refreshes roughly annually (last update 19 May 2026), IRP Commerce refreshes monthly, and Meta's platform-level figures refresh quarterly with earnings. Where a source has not been re-read since publication, the date stamped on its provenance block is the date we last read it at source — not the date we copied it from somewhere else.