 Soku AI
These three metrics sit next to each other in every ads dashboard, and most teams can define them individually while still misreading them together. That is because the interesting thing about reach, impressions and frequency is not their definitions — it is that they are not three independent numbers. They are one number split three ways, and the relationship between them is where all the useful information lives.
The definitions, precisely
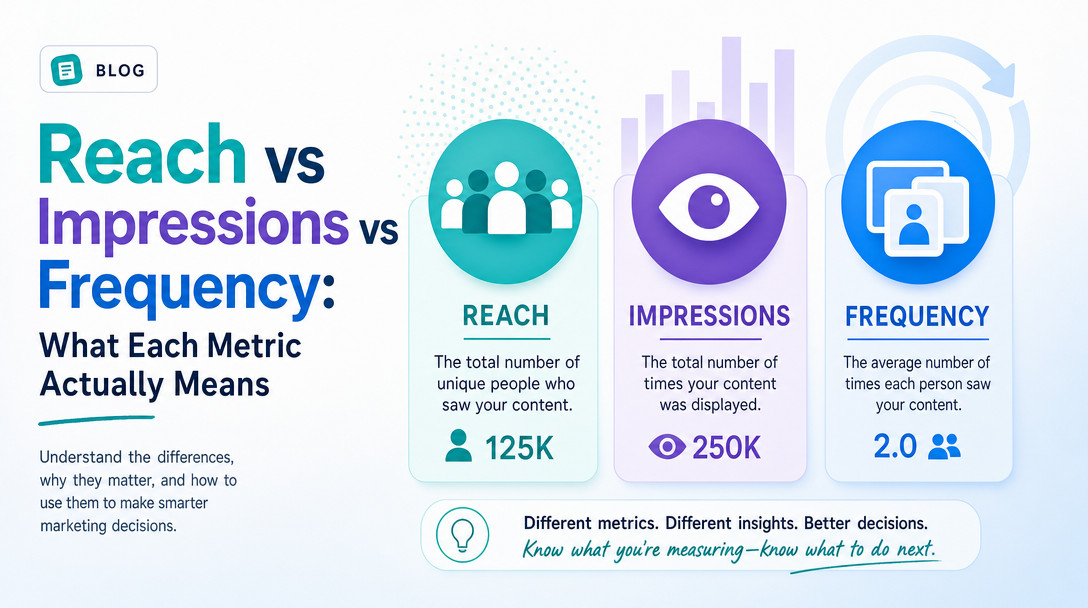
Impressions — the number of times your ad was served. Every serve counts, including repeat serves to the same person. If one person sees your ad six times, that is six impressions.
Reach — the number of unique people who saw your ad at least once. That same person contributes exactly 1 to reach, no matter how many times they saw it.
Frequency — the average number of times each reached person saw the ad:
Frequency = Impressions ÷ Reach
That identity is the whole thing. Any two of these determine the third. You cannot change one in isolation, and any conversation that treats them as three separate dials is going to produce a bad decision.
A worked example, because the identity is easier to trust once you have used it: a campaign delivers 900,000 impressions to 300,000 unique people. Frequency is 900,000 ÷ 300,000 = 3.0. The average person saw the ad three times. Note carefully that average — it is doing a lot of work, and we will come back to it, because it is the single most misleading part of this whole subject.
The distinction people actually get wrong
The definitions above are not where teams go wrong. Here is where they do.
Impressions are not views. An impression means the ad was served and had the opportunity to be seen. Whether a human looked at it is a different question, measured by viewability standards — and by the common standard, a display ad counts as viewable at 50% of pixels in view for one second, video at two seconds. A campaign can accumulate impressions from ads that scrolled past below the fold in a fraction of a second. Impressions measure delivery, not attention.
Reach is per-platform, and it is not additive. This is the expensive one. Meta reports reach for Meta. Google reports reach for Google. TikTok reports reach for TikTok. None of them know about the others. Adding them together produces a number that is wrong in a specific, predictable direction: it double-counts everyone who is on more than one platform, which for most consumer audiences is nearly everyone.
Concretely: if Meta reports 400,000 reach, Google reports 350,000 and TikTok reports 250,000, your total reach is emphatically not 1,000,000. The true figure could plausibly be 550,000–700,000 depending on overlap, and no dashboard will tell you which. The same person is in all three numbers.
Reach is deduplicated within a platform, but only by the identifier that platform can see. Even inside a single platform, "unique people" means unique as far as the platform can tell. A user on a phone, a laptop and a tablet, logged in on some and not others, may register as more than one person. This is why platform reach is best read as an upper bound on unique humans, not a headcount.
Frequency is an average hiding a distribution. A frequency of 3.0 does not mean everyone saw it three times. It is entirely consistent with 70% of your reach seeing the ad once and 30% seeing it 7.7 times. Those two scenarios call for completely different actions — the first says your delivery is spreading thin, the second says you are burning a segment — and the single frequency number cannot distinguish them. If your platform offers a frequency distribution breakdown, that view is worth more than the average it summarises.
Reading the three together
Once you accept that impressions ÷ reach = frequency, diagnosis becomes mechanical. Whenever impressions are roughly flat, reach and frequency must move in opposite directions. That single constraint explains most of what you will see.
Reach flat, frequency climbing. Your audience is saturated: the same budget is buying more repeat exposures because the platform has run out of fresh people to show it to. Nothing is broken, but you are now paying for diminishing returns. The fix is audience expansion — broader targeting, new lookalikes, a new geography — not more budget into the same pool.
Reach growing, frequency flat. Healthy scaling. You are buying new people at a stable exposure rate.
Both falling with flat spend. Delivery has a problem: rising competition, a shrinking eligible audience, an ad-set-level issue, or ads failing review. Look at CPM before anything else — if CPM is up and impressions are down, you are being outbid rather than mis-targeted.
Frequency climbing while CTR falls. The classic ad fatigue signature. Rising frequency alone is not fatigue; rising frequency with deteriorating response is. This is the pair worth putting on a monitoring dashboard together, because either half alone will mislead you. Our guide to creative testing covers the refresh side of the response.
What frequency is right?
The honest answer is that no universal number exists, and anyone quoting one to three decimal places is selling something. What does hold up is the shape of the relationship, and it has two ends.
At the low end, a single exposure rarely does much for an unfamiliar brand. Recognition needs repetition, so some frequency is not waste — it is how the message lands at all. At the high end, additional exposures stop adding recall and start actively costing you: the audience has already decided, and further impressions buy irritation instead of consideration. Between those two ends is a plateau that varies by how well-known you are, how complex the offer is, how long the purchase cycle runs, and how distinctive the creative is.
That is why the useful move is not to adopt a benchmark but to find your own inflection point from your own data. Segment your results by frequency bucket where your platform allows it, and look at where incremental conversions per impression stop improving. That number is specific to your account, and it will move when your creative does.
Two practical qualifiers matter more than any target:
Frequency caps do not compose across campaigns. A cap set on one campaign governs that campaign only. Run five campaigns at a cap of 2 each against overlapping audiences and a person can legitimately see 10 exposures. Account-level frequency is the sum of overlapping campaign-level delivery, and controlling it is a structural problem — one reach/frequency intent per audience-overlap group — rather than a settings problem. Our deeper treatment of reach and frequency optimization for video ads works through why per-campaign caps fail at the account level.
Retargeting and prospecting have different tolerances. A prospecting audience that has never heard of you and a retargeting pool that abandoned a cart yesterday are not the same problem. Judging both against one frequency target guarantees you are wrong about one of them. Split them, and set expectations separately.
The reporting trap: never sum reach
If you take one operational rule from this article, take this one. Reach can be averaged, compared and trended within a platform. It can never be summed across platforms, and in most cases it should not be summed across campaigns within a platform either, because the same person can be reached by two of your own campaigns.
What you can legitimately do:
- Sum impressions. Impressions are counts of serves, and serves do not overlap. Cross-channel total impressions is a valid number.
- Sum spend. Obviously.
- Compute a blended frequency only if you have a genuinely deduplicated reach figure, which platform reporting alone will not give you.
- Report reach per platform, labelled per platform. Not as a total.
If you genuinely need deduplicated cross-channel reach, it requires a source that sees the same identity across platforms — a media-mix or panel-based measurement product, or a clean-room arrangement — and it is a real project, not a spreadsheet formula. Most teams do not need it. What most teams need is to stop putting a summed reach number in a slide where a stakeholder will treat it as a headcount. If you are building that report, our free PPC report template sets out where each of these belongs.
Reach, impressions and CPM
One more relationship completes the picture. CPM is priced against impressions, not reach — cost per thousand impressions. That means a campaign delivering high frequency to a small audience can show a perfectly attractive CPM while reaching almost nobody new. Cheap impressions to the same people is not efficiency; it is repetition with a good-looking unit cost.
The counterpart metric is cost per unique reach — spend ÷ reach — which tells you what a new person actually costs. When CPM is flat but cost per unique reach is climbing, you are paying more for the same audience, and that is the earliest reliable signal that a targeting pool is exhausted. It usually shows up weeks before conversion metrics degrade, which makes it one of the more useful leading indicators available in a standard dashboard.
Where to go next
- Reach and frequency optimization for video ads — why per-campaign frequency caps fail and what to do structurally.
- Free PPC report template — where delivery metrics belong in a report, and which ones to leave out.
- MER vs ROAS) — the efficiency metrics that sit downstream of these delivery ones.
- CTR formula and benchmarks — the response metric to read alongside frequency.
- Ad fatigue and CPM — the base definitions.
FAQ
What is the difference between reach and impressions?
Reach counts unique people who saw the ad at least once. Impressions count every time the ad was served, including repeat serves to the same person. Impressions are always greater than or equal to reach.
How is frequency calculated?
Frequency = impressions ÷ reach. It is the average number of times each reached person was served the ad, over the reporting period you selected.
Can I add reach across Meta, Google and TikTok?
No. Each platform deduplicates only within itself, so summing them double-counts every person who uses more than one platform. Report reach per platform, or invest in a genuine cross-platform deduplicated measurement source.
Is a high frequency always bad?
No. Some repetition is how an unfamiliar message registers at all. Frequency becomes a problem when response deteriorates with it — rising frequency alongside falling CTR or conversion rate. Frequency alone is not a diagnosis.
Does frequency reset between campaigns?
Frequency is reported per campaign or ad set over your selected date range, and frequency caps apply only where you set them. A person can be exposed by several of your campaigns at once, so account-level frequency is higher than any single campaign's number suggests.
Why did my reach drop when I raised my budget?
Usually because the extra budget went into audiences that were already saturated, so it bought repeat impressions rather than new people — frequency rose and reach did not. Check cost per unique reach: if it climbed, the targeting pool is the constraint, not the budget.