 Soku AI
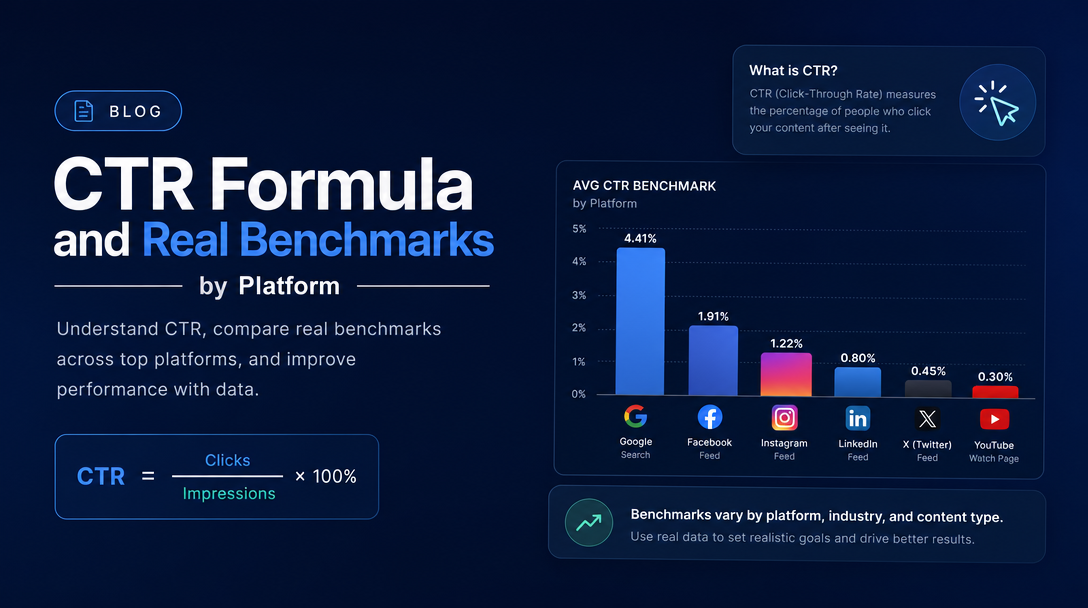
The CTR formula is:
CTR (%) = (Clicks ÷ Impressions) × 100In plain terms: click-through rate is clicks divided by impressions, expressed as a percentage. 50 clicks from 2,000 impressions is 2.5%.
That is the whole formula, and if it is all you came for, you now have it. But the formula is not where CTR goes wrong. It goes wrong in the denominator — because "impression" is not a standard unit, and it means something materially different on each platform. Comparing a 6% Google Search CTR with a 1.5% Meta CTR and concluding that search creative is four times better is the single most common misreading of this metric, and it is a comparison of two different measurements wearing the same name.
This page covers the formula and its variants, what an impression actually is on each platform, honest benchmarks with their caveats, and — using our own search data — what CTR looks like when position is the thing driving it.
The formula, and the three variants worth knowing
Standard CTR. Clicks ÷ impressions × 100. This is what every ad platform reports by default.
Unique CTR. Unique clicks ÷ unique users reached (reach) × 100. This strips out the same person clicking twice and the same person being served ten times. It is a better measure of how many people found this compelling and a worse measure of how efficiently this placement generates traffic. Meta reports both; the gap between them tells you how much frequency is doing.
Expected CTR. Not something you calculate — something Google calculates about you. It is one of the three components of Quality Score, and it estimates how likely your ad is to be clicked relative to other ads in the same position for the same query. The "relative to position" part is the important bit: Google is already adjusting for the fact that position drives clicks, so a low expected CTR is a statement about your ad, not about your rank.
Effective CTR against a benchmark. Your CTR ÷ the expected CTR for your position and format. This is the only version of the metric that supports a decision, and almost nobody calculates it. A 2% CTR at position 8 and a 2% CTR at position 1 are not the same event — the first is excellent and the second is a problem.
Worked examples
| Scenario | Clicks | Impressions | CTR |
|---|---|---|---|
| Search ad, branded term | 480 | 6,000 | 8.00% |
| Search ad, generic term | 90 | 4,500 | 2.00% |
| Meta prospecting | 310 | 62,000 | 0.50% |
| Meta retargeting | 240 | 8,000 | 3.00% |
| Display banner | 45 | 90,000 | 0.05% |
Every one of those could be a good result or a bad one. Nothing in the arithmetic tells you which.
The trap: an "impression" is not the same thing twice
This is the section that makes the benchmarks below usable, and it is missing from nearly every CTR guide.
- Google Search counts an impression when your ad is served on the results page. The bar is served, not seen.
- Google Display counts a served impression too, which is why viewability is reported as a separate metric — a large share of display impressions are never actually onscreen. This is most of why display CTR looks catastrophic next to search.
- Meta counts an impression the first time the ad enters the screen. That is a stricter, more viewer-centric definition than "served", and it means a Meta impression represents more genuine exposure than a display impression does.
- Video platforms vary by format, and "impression" for an in-feed video ad, a skippable pre-roll and a bumper are three different events with three different relationships to attention.
Three consequences:
- Cross-platform CTR comparison is mostly meaningless. Search CTR is higher than social CTR partly because of intent — people searching are looking for something — and partly because the denominators are counted differently. You cannot separate the two from the outside, so do not try to rank platforms by CTR.
- Display CTR is not evidence that display is broken. It is evidence that a served impression is a weak unit. Judge display on viewability and view-through behaviour instead, which we cover in display and banner ad examples.
- The only valid CTR comparisons are within a platform, within a format, and ideally within a position band. Everything else is a vibe.
2026 CTR benchmarks by platform — and how much to trust them
Here is the honest framing before the table: there is no authoritative, primary-source CTR benchmark dataset. The platforms do not publish one. Every number circulating in 2026 benchmark articles comes from an agency or a tool vendor aggregating the accounts they happen to have access to, and those samples are not representative of anything in particular — they are skewed by client mix, spend level, industry and geography.
The figures below are the directional consensus across published 2026 compilations. Treat them as a rough orientation, not as a target.
| Platform | Typical average CTR | Notes |
|---|---|---|
| Google Search | ~6–7% | Heavily inflated by branded terms. Non-brand search realistically sits far lower. |
| Google Display | ~0.5% | Served-impression denominator; check viewability before interpreting. |
| Meta (Facebook/Instagram) | ~1.5–1.8% | 1–2% commonly described as strong, 2.5%+ as exceptional. |
| TikTok | ~1% | Wide variance; ecommerce verticals report substantially higher. |
| ~0.5% | Structurally lower — B2B audiences, higher CPMs, lower click intent. | |
| YouTube | ~0.65% | 1%+ commonly described as strong. Varies sharply by format. |
The Google Search number deserves a warning. A ~6.6% average is quoted everywhere, and it is close to useless as a target, because branded search commonly runs 10–20%+ while cold non-brand terms run 1–3%. An account average is therefore mostly a measure of how much of your traffic is branded, not of how good your ads are. If you take one operational lesson from this page: always split branded and non-brand before looking at CTR. Most accounts that "have a CTR problem" have a traffic-mix change.
Industry variation is equally wide — published compilations put arts and entertainment above 12% on search while other verticals sit near 6%, and on Meta put home decor and fashion near 2.9% against a 1.5% average. A cross-industry average is the midpoint of a distribution you are not in.
What CTR is actually for
CTR is a diagnostic, not a goal. Three things it genuinely tells you:
1. Message-to-audience fit. A low CTR usually means the ad is not speaking to the person seeing it. That is either a targeting problem or a creative problem, and the search terms report or placement breakdown will tell you which.
2. Creative fatigue, when tracked over time. A CTR that declines steadily at constant targeting and frequency-adjusted delivery is the clearest early signal that a creative has been seen too often. The absolute number matters much less than the slope.
3. Auction economics on search. Expected CTR feeds Quality Score, which affects both Ad Rank and what you pay per click. On search specifically, improving CTR can lower CPC — one of the few places in paid media where a creative improvement directly reduces cost.
And three ways it misleads
High CTR can be a warning. An ad that promises broadly and qualifies nobody earns clicks from people who bounce. If CTR rose and conversion rate fell by more, the ad got worse. Always read CTR next to conversion rate; neither is interpretable alone.
CTR is not a conversion metric and correlates with conversions weakly. The best-converting ad in an account is very often not the highest-CTR ad. Optimising creative on CTR alone reliably drifts toward curiosity-bait.
CTR at low volume is noise. 3 clicks from 100 impressions is 3%, and it is not a measurement — it is a coin flip. Before comparing two variants, ask how many clicks the smaller one has. Under about 100 clicks per variant, differences of a percentage point are usually not real, and calling a winner at that volume is the most common testing error in paid media.
Our own data: what CTR looks like when position drives it
Everything above is about paid CTR. Organic search is where the position effect is cleanest to demonstrate, so here is a real dataset rather than a borrowed one.
Across the 90 days ending 2026-08-11, soku.ai recorded, in Google Search Console:
- 3,672 clicks
- 192,921 impressions
- 1.90% CTR
- 13.1 average position
That site-wide 1.90% is a nearly useless number on its own — and demonstrating why is the point. Decomposed, the same dataset contains pages at position 8–9 with CTRs of 0.08%, and pages at position 1 with CTRs under 1%. Both look alarming against any published benchmark. Neither is a creative problem:
- The position-8 pages with near-zero CTR are ranking below an AI-generated answer that resolves the query before a reader reaches them. The impressions are real, the ranking is real, and the click never had a chance. No headline rewrite fixes that.
- The position-1 pages with sub-1% CTR rank first for our own brand name. Brand-navigational impressions are counted generously and satisfied in many ways that are not a click — which is exactly the denominator problem from earlier, appearing in organic form.
The general lesson transfers directly to paid: before treating a low CTR as a creative failure, find out what the impressions actually were. In our case, two entirely different mechanisms produced the same alarming-looking number, and the fix for one is nothing like the fix for the other. This is also why we do not retitle pages purely because their CTR is low — several of ours already have titles matching their top query verbatim.
How to improve CTR (in the order that works)
- Split brand from non-brand. Most CTR "problems" are mix changes. Do this before anything else.
- Check position and viewability. On search, a CTR drop is very often a position drop. On display and social, check whether the impressions were seen at all.
- Match the ad to the query or audience more specifically. The largest genuine creative gains come from specificity — the actual product, the actual price, the actual objection — not from stronger adjectives.
- Use every asset and extension available. On search, sitelinks, callouts and structured snippets increase the physical size of your result, and size drives clicks independently of copy quality.
- Put a number in it. A price, a quantity, a timeframe. The cheapest available credibility.
- Test one variable at a time, with enough volume. Changing the headline, image and CTA together tells you a variant won, not why.
- Refresh before fatigue, not after. Watch the slope, not the level.
And the discipline underneath all of it: decide in advance what CTR change would make you act, and what conversion-rate change would make you reverse that decision. A CTR improvement that costs you conversion rate is a loss recorded as a win, and it is recorded that way surprisingly often.
Frequently asked questions
What is the CTR formula?
CTR = (clicks ÷ impressions) × 100. For example, 50 clicks from 2,000 impressions is a 2.5% CTR.
What is a good CTR?
It depends entirely on platform, format, industry and position. As rough orientation: 6–7% on Google Search (heavily inflated by brand terms), around 0.5% on Google Display, 1.5–1.8% on Meta, around 1% on TikTok, around 0.5% on LinkedIn. Compare against your own history and your own segment before comparing against any published figure.
Why is my display CTR so much lower than my search CTR?
Partly intent — display audiences were not looking for you — and partly measurement: display counts served impressions, many of which were never onscreen. The two numbers are not directly comparable.
Is a higher CTR always better?
No. An ad that attracts clicks by being vague or overpromising raises CTR and lowers conversion rate. Always read the two together.
How do I calculate CTR in a spreadsheet?
Divide the clicks cell by the impressions cell and format the result as a percentage — =B2/C2 formatted as a percentage, or =B2/C2*100 for a plain number.
What is the difference between CTR and unique CTR?
Standard CTR divides all clicks by all impressions. Unique CTR divides unique clicks by the number of people reached, removing repeat clicks and repeat exposure. The gap between them shows how much frequency is contributing.
How many clicks do I need before CTR is meaningful?
As a working rule, at least 100 clicks per variant before comparing. Below that, differences of a percentage point are usually noise.
Where to go next
- Display and banner ad examples — why display CTR is structurally low and what to judge it on instead.
- Google Ads campaign structure — separating brand from non-brand, which is where most CTR analysis should start.
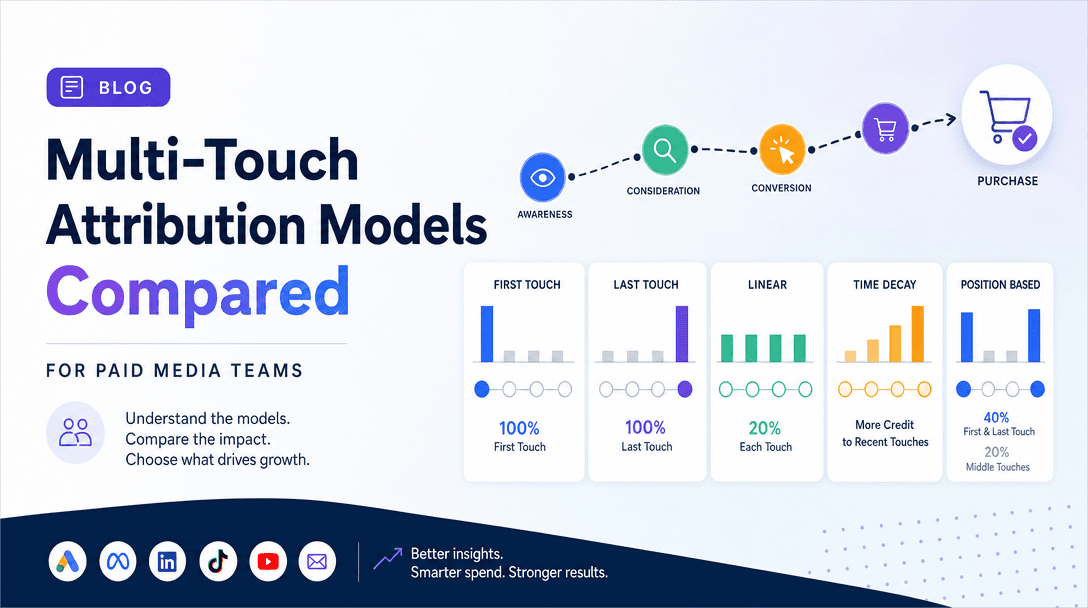
- Multi-touch attribution models compared — what to measure once you accept CTR is a diagnostic rather than an outcome.
- Google Ads quality score audit — where expected CTR turns into money.
Sources
Platform benchmark ranges are the directional consensus across published 2026 CTR benchmark compilations; no platform publishes an authoritative benchmark dataset, and all such figures derive from non-representative vendor and agency samples — they are orientation, not targets. Impression-counting definitions reflect each platform's documented measurement behaviour. The soku.ai search dataset (3,672 clicks, 192,921 impressions, 1.90% CTR, 13.1 average position over the 90 days ending 2026-08-11) is our own first-party Google Search Console data. The formula variants, the denominator analysis, the diagnostic framework and all recommendations are Soku's own analysis.