 Soku AI
Every performance team eventually has the same bad meeting. The ad platforms report a healthy return. Revenue is flat. Someone opens the bank account and the two stories do not reconcile. What follows is usually an argument about attribution windows, when the actual problem is that the team has been running the business on a metric that was never designed to describe the business.
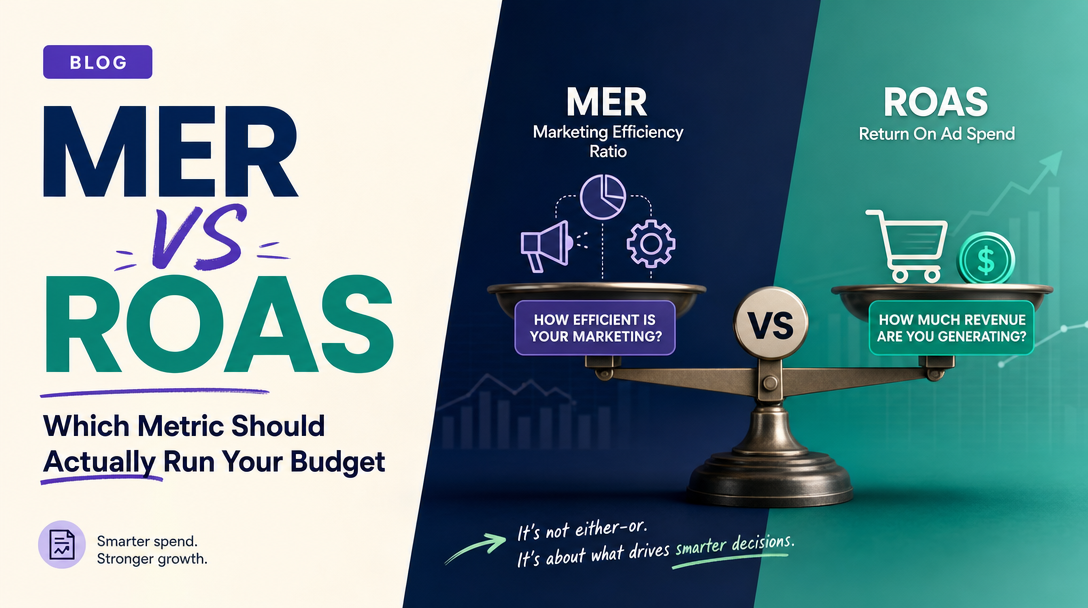
This is what MER is for, and it is why the two metrics need to coexist rather than compete.
What MER means
MER stands for Marketing Efficiency Ratio. It is sometimes written as blended ROAS, and occasionally as aMER (a-MER) when restricted to acquisition spend only.
MER = Total revenue ÷ Total marketing spend
Both terms are deliberately total. Total revenue means everything the business took in over the period, from every source — paid, organic, email, direct, retention, wholesale if you have it. Total marketing spend means everything you spent to market over the same period, across every channel.
That is the entire formula. Its power is not in its sophistication; it is in its refusal to be clever. MER cannot be inflated by an attribution setting, because it does not use attribution. There is no window, no model, no pixel, no view-through, no platform's opinion. It is two numbers you can pull from your accounting system and divide.
What ROAS means, and the word people skip
ROAS = Attributed revenue ÷ Ad spend
The word that matters is attributed. ROAS is always a claim about causation made by whoever is counting, and on a platform dashboard, the entity counting is the platform that wants the credit.
That is not an accusation of dishonesty. It is a structural fact: Meta can only see conversions Meta observed, and it counts them according to the window and model you configured. Google does the same. So does TikTok. None of them subtract each other. If someone sees a Meta ad, then searches your brand, clicks a Google ad, and buys, both platforms can legitimately claim that sale under their own rules. Neither is lying. The sale still happened once.
For a plain-language walk through the underlying number, our ROAS glossary entry covers the definition; this article is about what happens when you try to run a company on it.
The arithmetic that makes the problem concrete
Numbers make this obvious in a way that argument does not. Take a month:
| Channel | Spend | Platform-reported revenue |
|---|---|---|
| Meta | $40,000 | $140,000 |
| $30,000 | $120,000 | |
| TikTok | $10,000 | $20,000 |
| Total | $80,000 | $280,000 |
Weighted platform ROAS: $280,000 ÷ $80,000 = 3.5×. Every channel individually clears a 2× target. The dashboards are green.
Now the accounting system. Total revenue for the month, all sources: $200,000. Total marketing spend including the $80,000 in ads plus $12,000 in agency fees, tools and creative production: $92,000.
MER: $200,000 ÷ $92,000 = 2.17×.
The gap is not a rounding error. The platforms collectively claimed $280,000 of a business that only produced $200,000 — $80,000 of revenue claimed twice or more, before you even account for the organic and returning-customer revenue that sits inside that $200,000 and was never caused by an ad at all. On a 30% contribution margin, the 3.5× story says you made money comfortably. The 2.17× story says $200,000 × 30% = $60,000 of contribution against $92,000 of marketing spend, and you lost $32,000.
This is the failure mode. Not a slightly optimistic number. A sign error on profitability.
What each metric is actually good at
The temptation after that example is to declare ROAS useless. That is the opposite mistake, and it produces its own disaster: a team that only watches MER has no idea which thing to change when MER drops.
MER tells you whether the machine is working. It is the right number for the question "should we spend more or less in total?" It is the number to put in front of a CFO, to set as a company-level target, and to watch weekly. It is also the only one of the two that survives a tracking change — when a browser, an OS or a privacy regulation breaks measurement, platform ROAS moves and MER does not, because MER never depended on the tracking in the first place.
ROAS tells you which lever moved. It is the right number for the question "which campaign, ad set, audience or creative should get the next dollar?" Within a single platform, comparing two campaigns' ROAS to each other is a reasonable relative judgement, because they share the same attribution rules and the same biases. The bias does not vanish, but it is roughly constant across the comparison, so it mostly cancels.
The rule that follows is simple enough to put on a wall:
MER decides how much. ROAS decides where.
Use MER to set the total budget and to judge whether the overall programme is healthy. Use platform ROAS to allocate that budget inside a platform. Do not use platform ROAS to decide the total, and do not use MER to pick a winning ad.
Reading the two together
The most useful thing about tracking both is that the relationship between them is more diagnostic than either alone. Four situations, and what each means:
MER stable, platform ROAS rising. Almost always a measurement change rather than a performance change — a longer attribution window, a new conversion event, advanced matching switching on, view-through conversions appearing in a total. The business did not improve; the counting got more generous. Check what changed in your measurement configuration before you celebrate. This is exactly the trap that makes a metric like ChatGPT Ads' new view-through column worth handling carefully.
MER falling, platform ROAS stable. Usually scale hitting diminishing returns, or paid cannibalising channels you were not paying for. The platforms keep claiming the same efficiency on the conversions they can see, while the incremental ones get more expensive. This is the most dangerous quadrant because nothing on a platform dashboard looks wrong.
Both falling. Genuine performance decline. Creative fatigue, a competitor entering the auction, seasonality, a landing-page regression. This is the honest, diagnosable case.
MER rising, platform ROAS falling. Often a sign that something outside paid is working — a PR moment, an organic surge, a retention programme — while paid is being credited with less of it. Do not cut paid reflexively; check whether paid is what made the other thing possible.
The two adjustments that make MER honest
Raw MER has real weaknesses, and pretending otherwise is how teams end up distrusting it. Two adjustments handle most of them.
Separate acquisition from retention. A business with a large returning-customer base will show a flattering MER that has almost nothing to do with its advertising. Splitting revenue into new-customer and returning-customer revenue, and comparing new-customer revenue against acquisition spend only, gives you a-MER — a number that actually moves when your prospecting works. Keep both: blended MER for the CFO conversation, a-MER for the growth conversation.
Use contribution margin, not revenue, when the decision is about profit. Revenue-based MER treats a $100 sale at 20% margin the same as a $100 sale at 60%. If your product mix shifts, MER can improve while profit falls. For budget decisions, a contribution-margin version — contribution ÷ marketing spend — is the number that corresponds to the thing you care about.
Its remaining weakness is unfixable and worth stating plainly: MER has a lag problem. It moves slowly, it does not tell you what to change, and if your business has a long consideration cycle, this month's MER partly reflects last quarter's spend. MER is a thermostat, not a steering wheel. That is precisely why it does not replace ROAS.
Where incrementality fits
Neither metric answers the question a CFO will eventually ask: what would have happened if we had not spent this? MER cannot isolate causation because it never separates channels. ROAS cannot because it assumes the touchpoints it observed caused the sale.
The only method that answers it directly is an experiment — geo holdouts, conversion lift tests, or a deliberate spend-down in a controlled slice — and our guide to incrementality testing covers how to run one without burning a quarter. In practice, the mature setup is a three-layer stack: MER as the weekly health check, platform ROAS for in-platform allocation, and incrementality tests run periodically to calibrate how much of the platforms' claimed credit is real. If you want the middle layer done properly, multi-touch attribution models compared lays out which model is worth the effort at your conversion volume.
The operating cadence that works
- Weekly: MER, against a target set from your contribution margin. This is the number that authorises a budget increase or a pullback.
- Weekly, within platform: ROAS by campaign and ad set, used only for relative allocation inside that platform. Never summed across platforms.
- Monthly: a-MER, to check the acquisition engine independently of retention revenue.
- Quarterly: one incrementality test on your largest channel, to recalibrate how much of its reported ROAS to believe.
Set the MER target from unit economics rather than from a benchmark you read somewhere. If your contribution margin is 40% and you want marketing to break even on first purchase, your MER floor is 1 ÷ 0.40 = 2.5×. If you are willing to acquire at a loss against a known repeat rate, it is lower. The number is yours; it is not an industry figure.
Where to go next
- Multi-touch attribution models compared — choosing an attribution model by conversion volume.
- Cross-channel marketing attribution — reconciling platforms that all claim the same sale.
- Incrementality testing — the experiment that settles the argument.
- Free PPC report template — where to put MER and ROAS in a report people will actually read.
- ROAS glossary entry — the base definition.
FAQ
What does MER stand for?
Marketing Efficiency Ratio. It is total revenue divided by total marketing spend over the same period, across every channel and every revenue source.
Is MER the same as blended ROAS?
In practice, yes — the terms are used interchangeably. Some teams use "blended ROAS" for total revenue ÷ total ad spend and reserve MER for total revenue ÷ total marketing spend including agency fees, tools and production. Whichever you use, define it once and never change the denominator mid-year.
What is a good MER?
There is no universal answer, and any number quoted as one should be treated with suspicion. It is set by your contribution margin and your tolerance for acquiring at a loss. A break-even-on-first-purchase MER is 1 ÷ contribution margin — 2.5× at a 40% margin, 3.3× at 30%.
Why is my platform ROAS so much higher than my MER?
Three reasons compounding: platforms count conversions they observed and do not subtract each other, so the same sale is claimed more than once; platform revenue excludes organic and returning-customer revenue that your MER denominator is still paying for; and MER's denominator often includes fees, tools and production that platform ROAS ignores.
Should I replace ROAS with MER?
No. MER tells you how much to spend in total; ROAS tells you where to put it inside a platform. Dropping ROAS leaves you with no way to choose between two campaigns.
Does MER work for lead generation, not just ecommerce?
Yes, with one substitution: use pipeline value or closed-won revenue instead of order revenue, and be explicit about the lag between spend and revenue recognition. The longer your sales cycle, the more you should compare MER across matched periods rather than month to month.